🎲
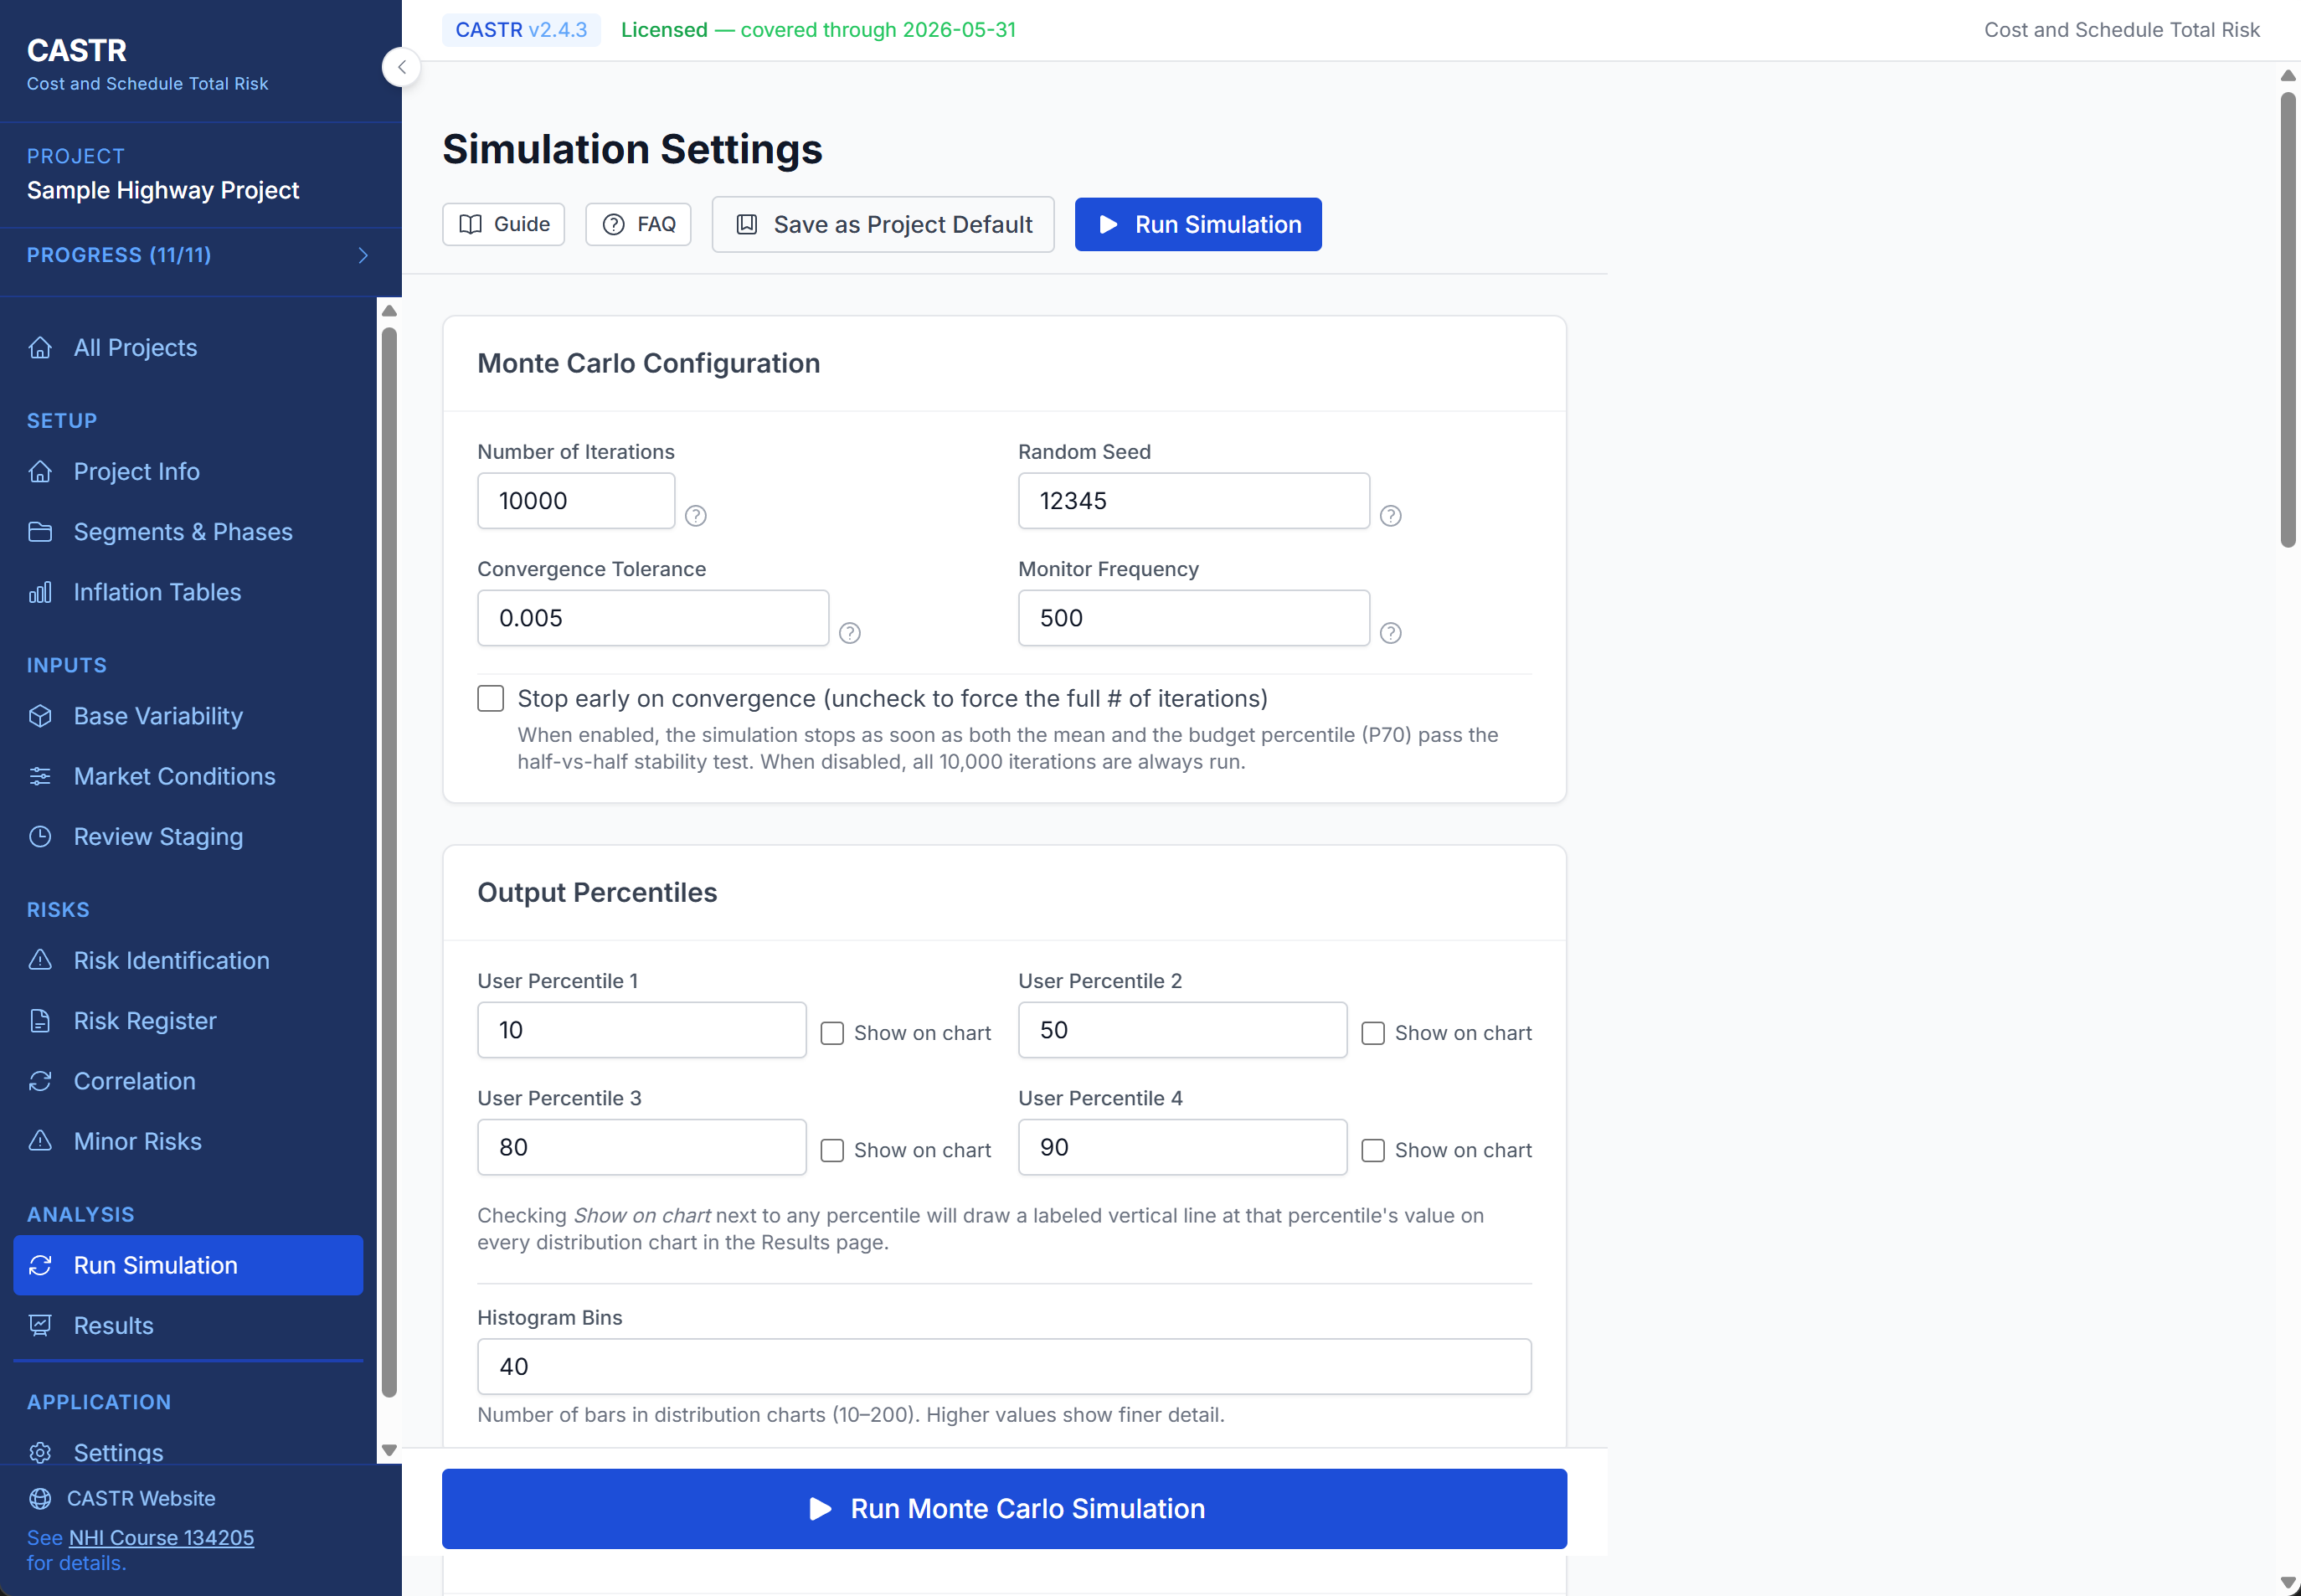
Monte Carlo Simulation
Run 100 to 100,000 iterations with convergence-based early termination, reproducible seed control, and half-vs-half stability testing on mean and budget percentile.
📊
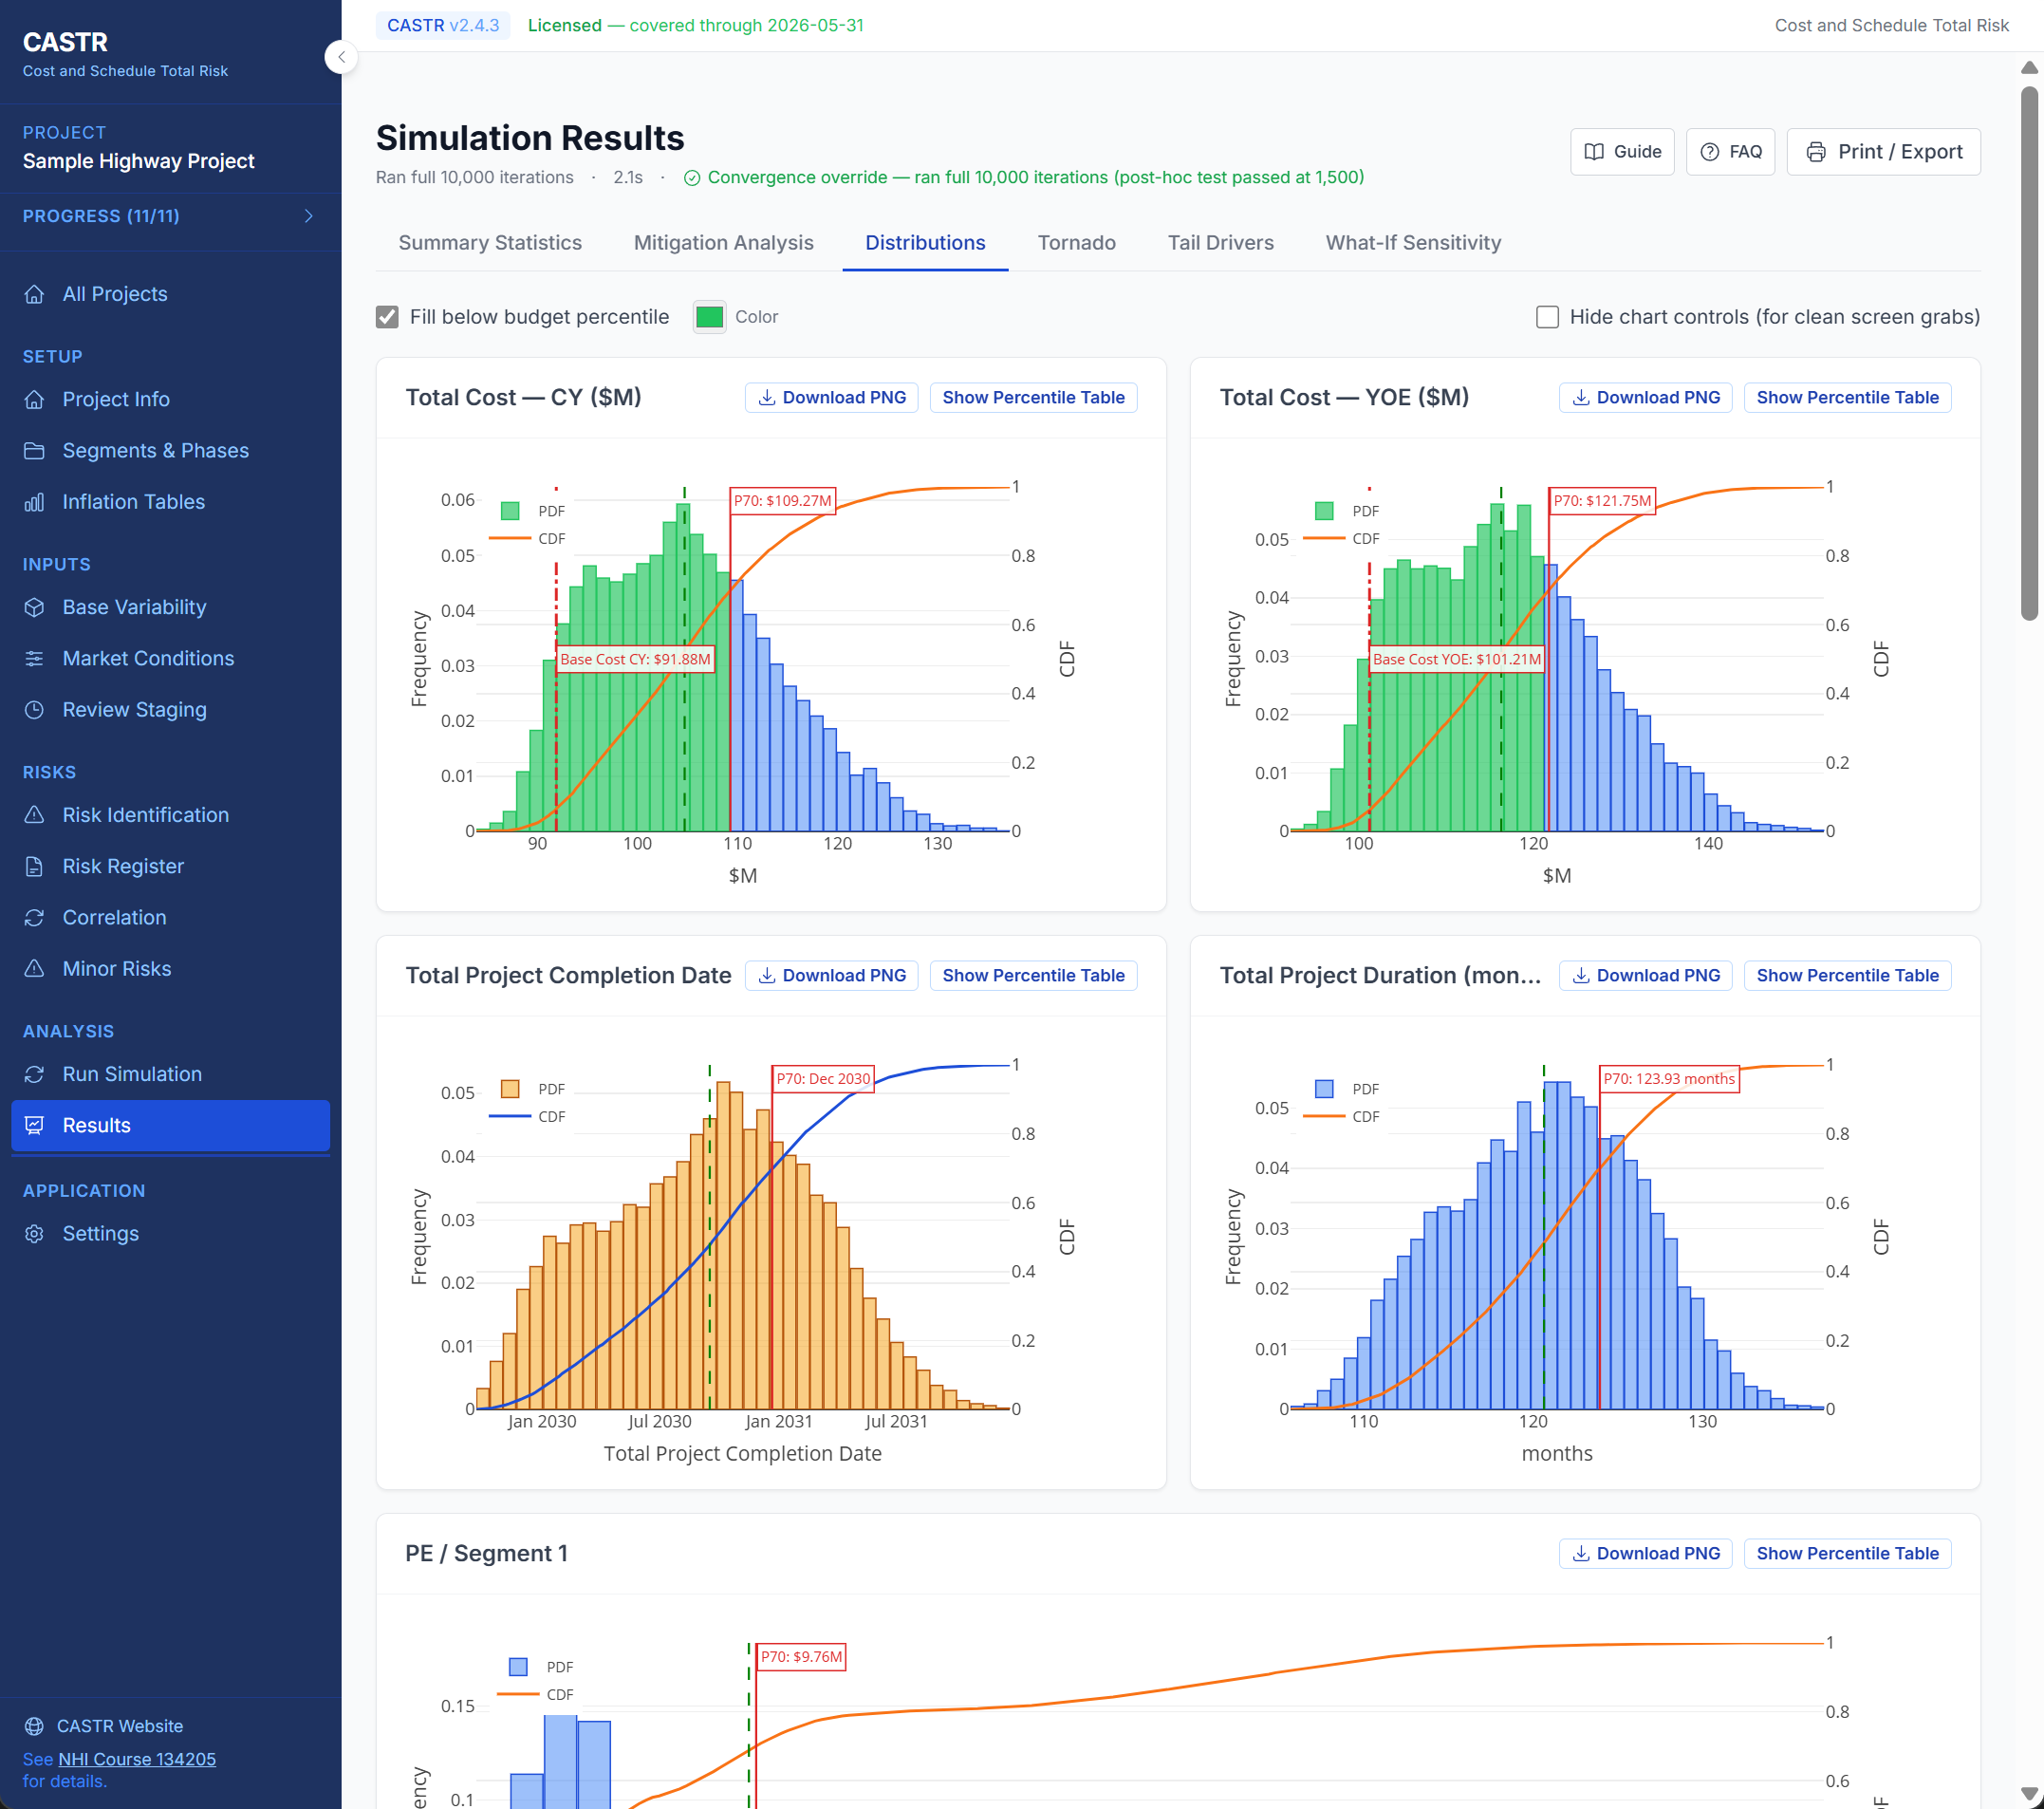
Distribution Charts
Interactive histogram + CDF overlay for total cost (CY and YOE), duration, and project completion date. Configurable bin counts, labeled percentile lines, dynamic bar coloring around the budget cutoff, and 300 DPI PNG download.
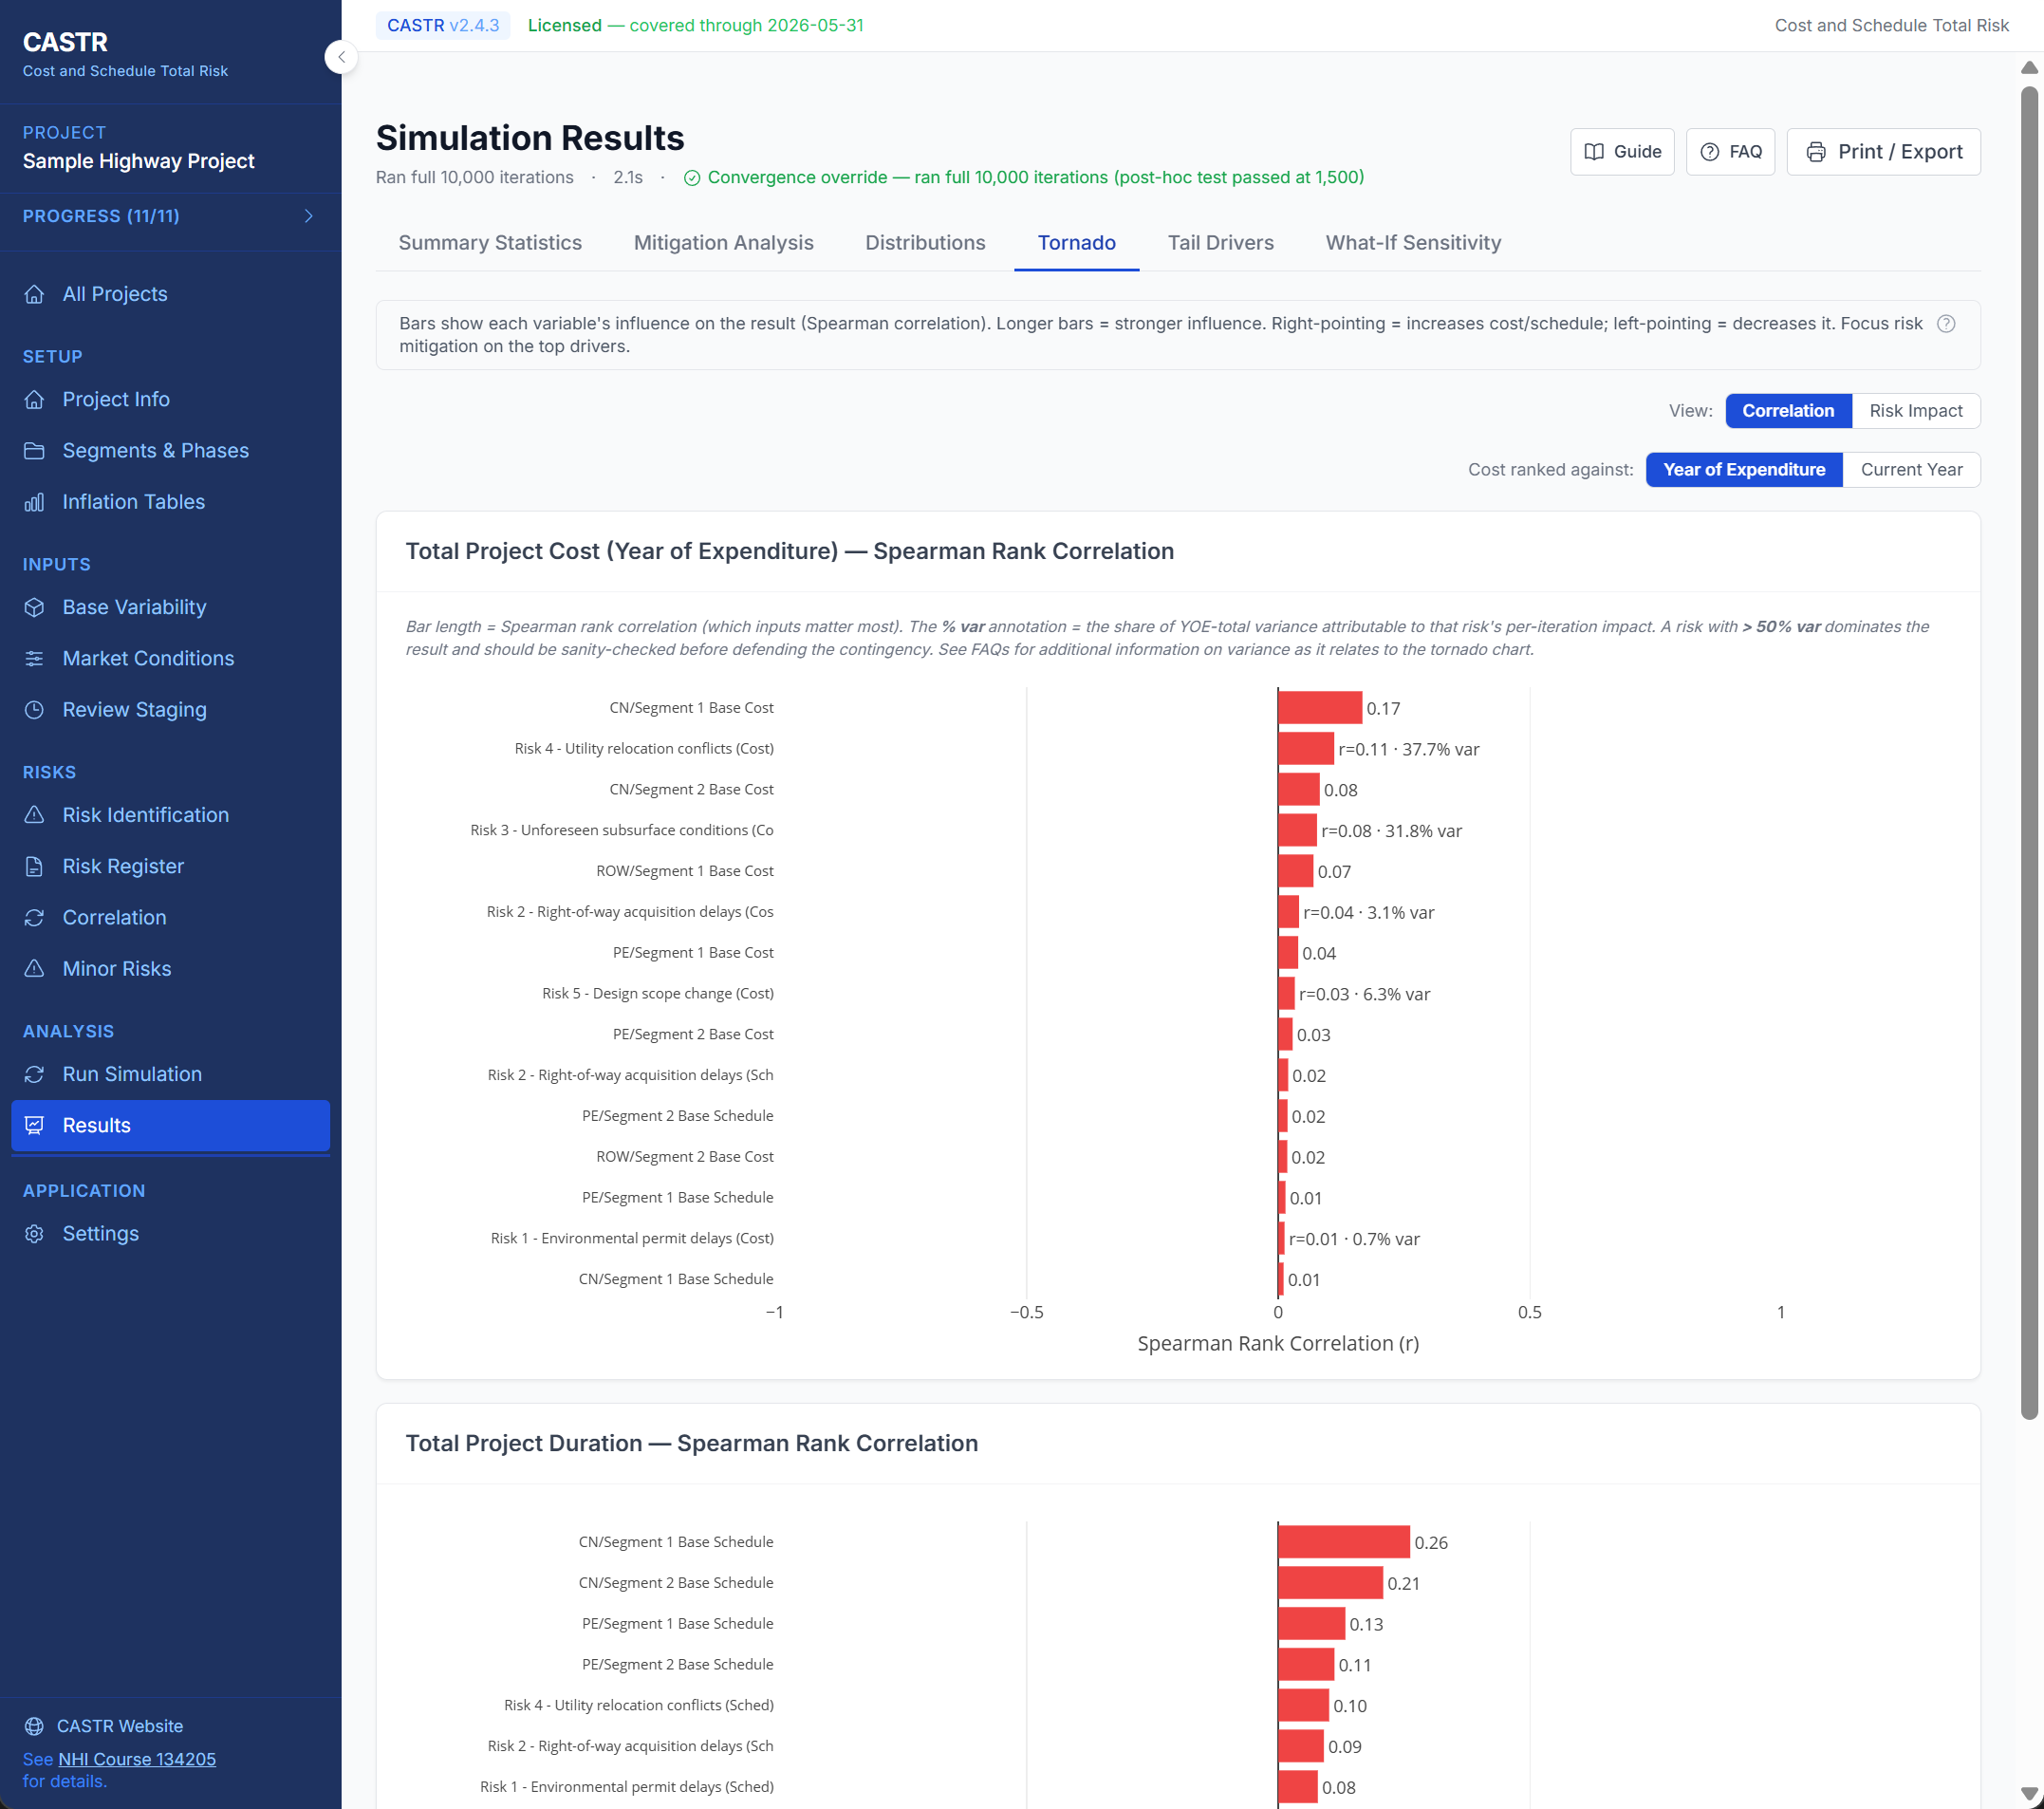
🏇
Tornado & Sensitivity Analysis
Spearman rank correlation tornado charts with variance share annotation. Risk Impact mode shows bar range, mode, and EV markers. Toggle EV vs. variance share sorting across cost CY, cost YOE, and schedule views.
📈
Tail Driver Analysis
Understand which risks drive extreme outcomes with fire rate comparison, excess contribution metrics, and plain-language interpretations.
💰
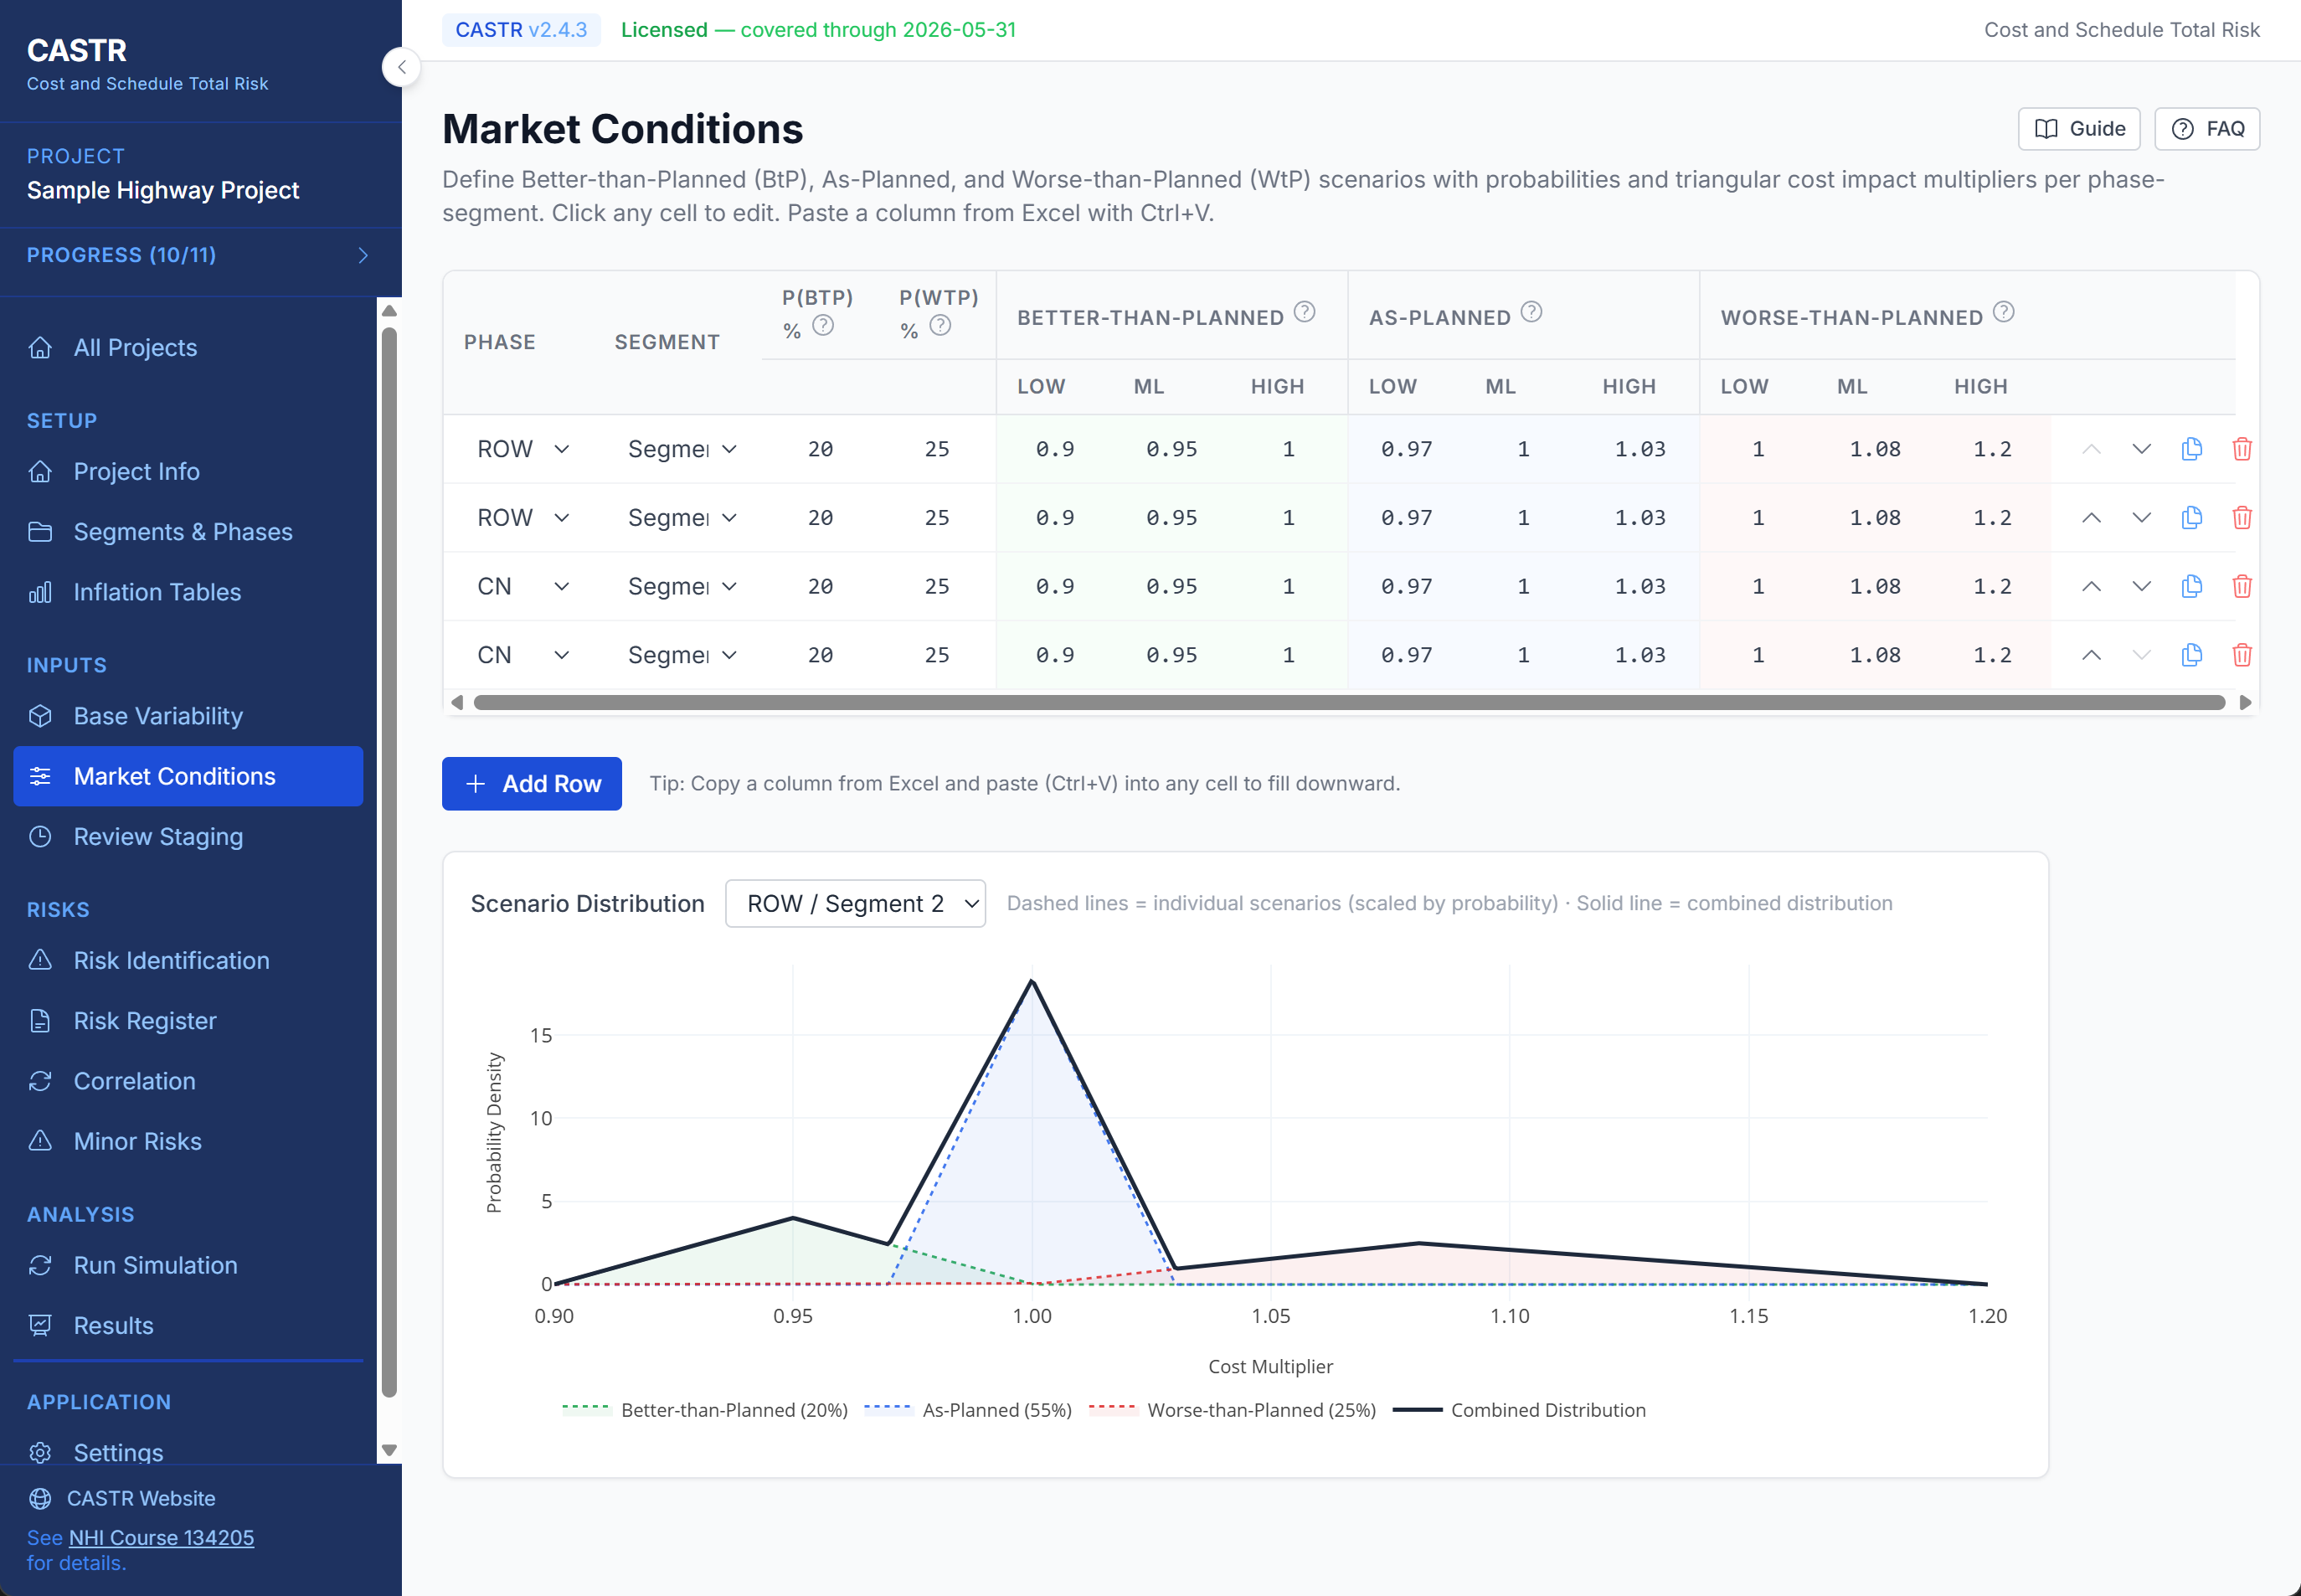
Market Conditions Modeling
Model Better-Than-Planned, As-Planned, and Worse-Than-Planned market scenarios with probability-weighted cost multipliers.
🔗
Correlation Analysis
Define cost-cost, schedule-schedule, and cost-schedule cross-pair correlations using a Gaussian copula. Automatic positive-semi-definite matrix repair when user entries are inconsistent, with an achieved-vs-requested correlation report.
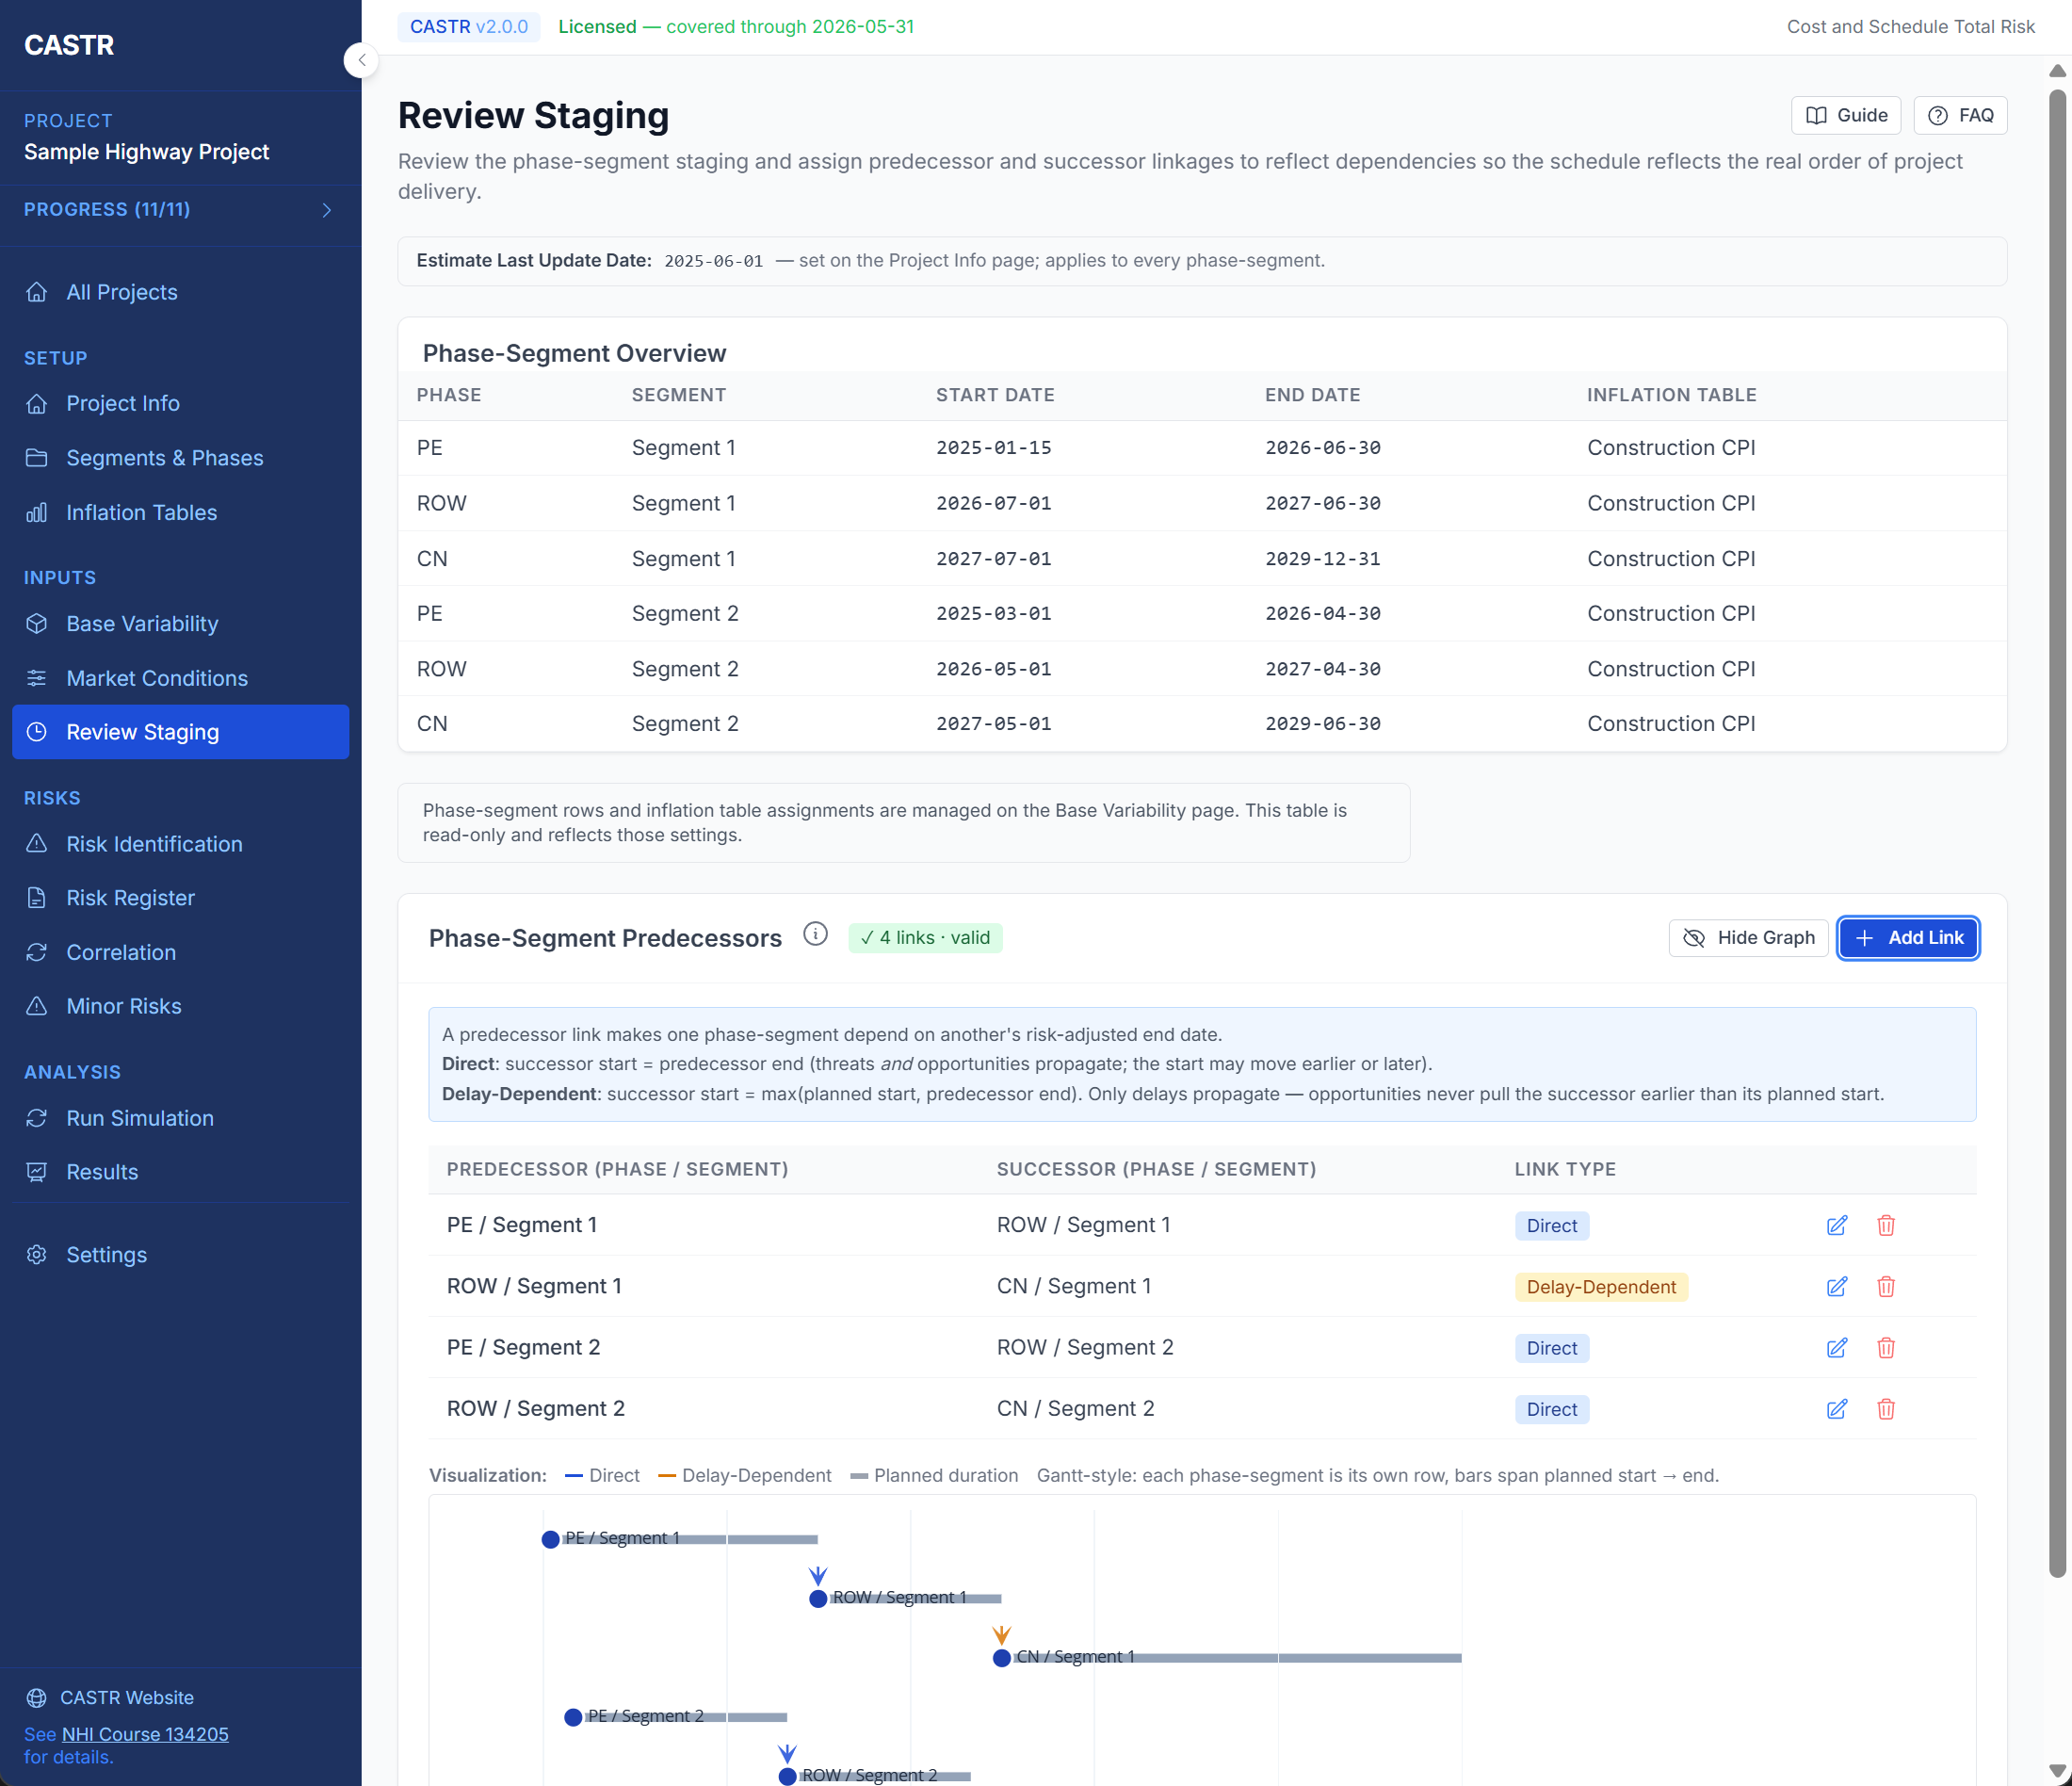
📅
Review Staging & Dependencies
Review phase-segment staging and assign predecessor/successor linkages with Direct or Delay-Dependent rules so the schedule reflects the real order of project delivery. Convert current-year costs to year-of-expenditure dollars with customizable inflation tables.
📄
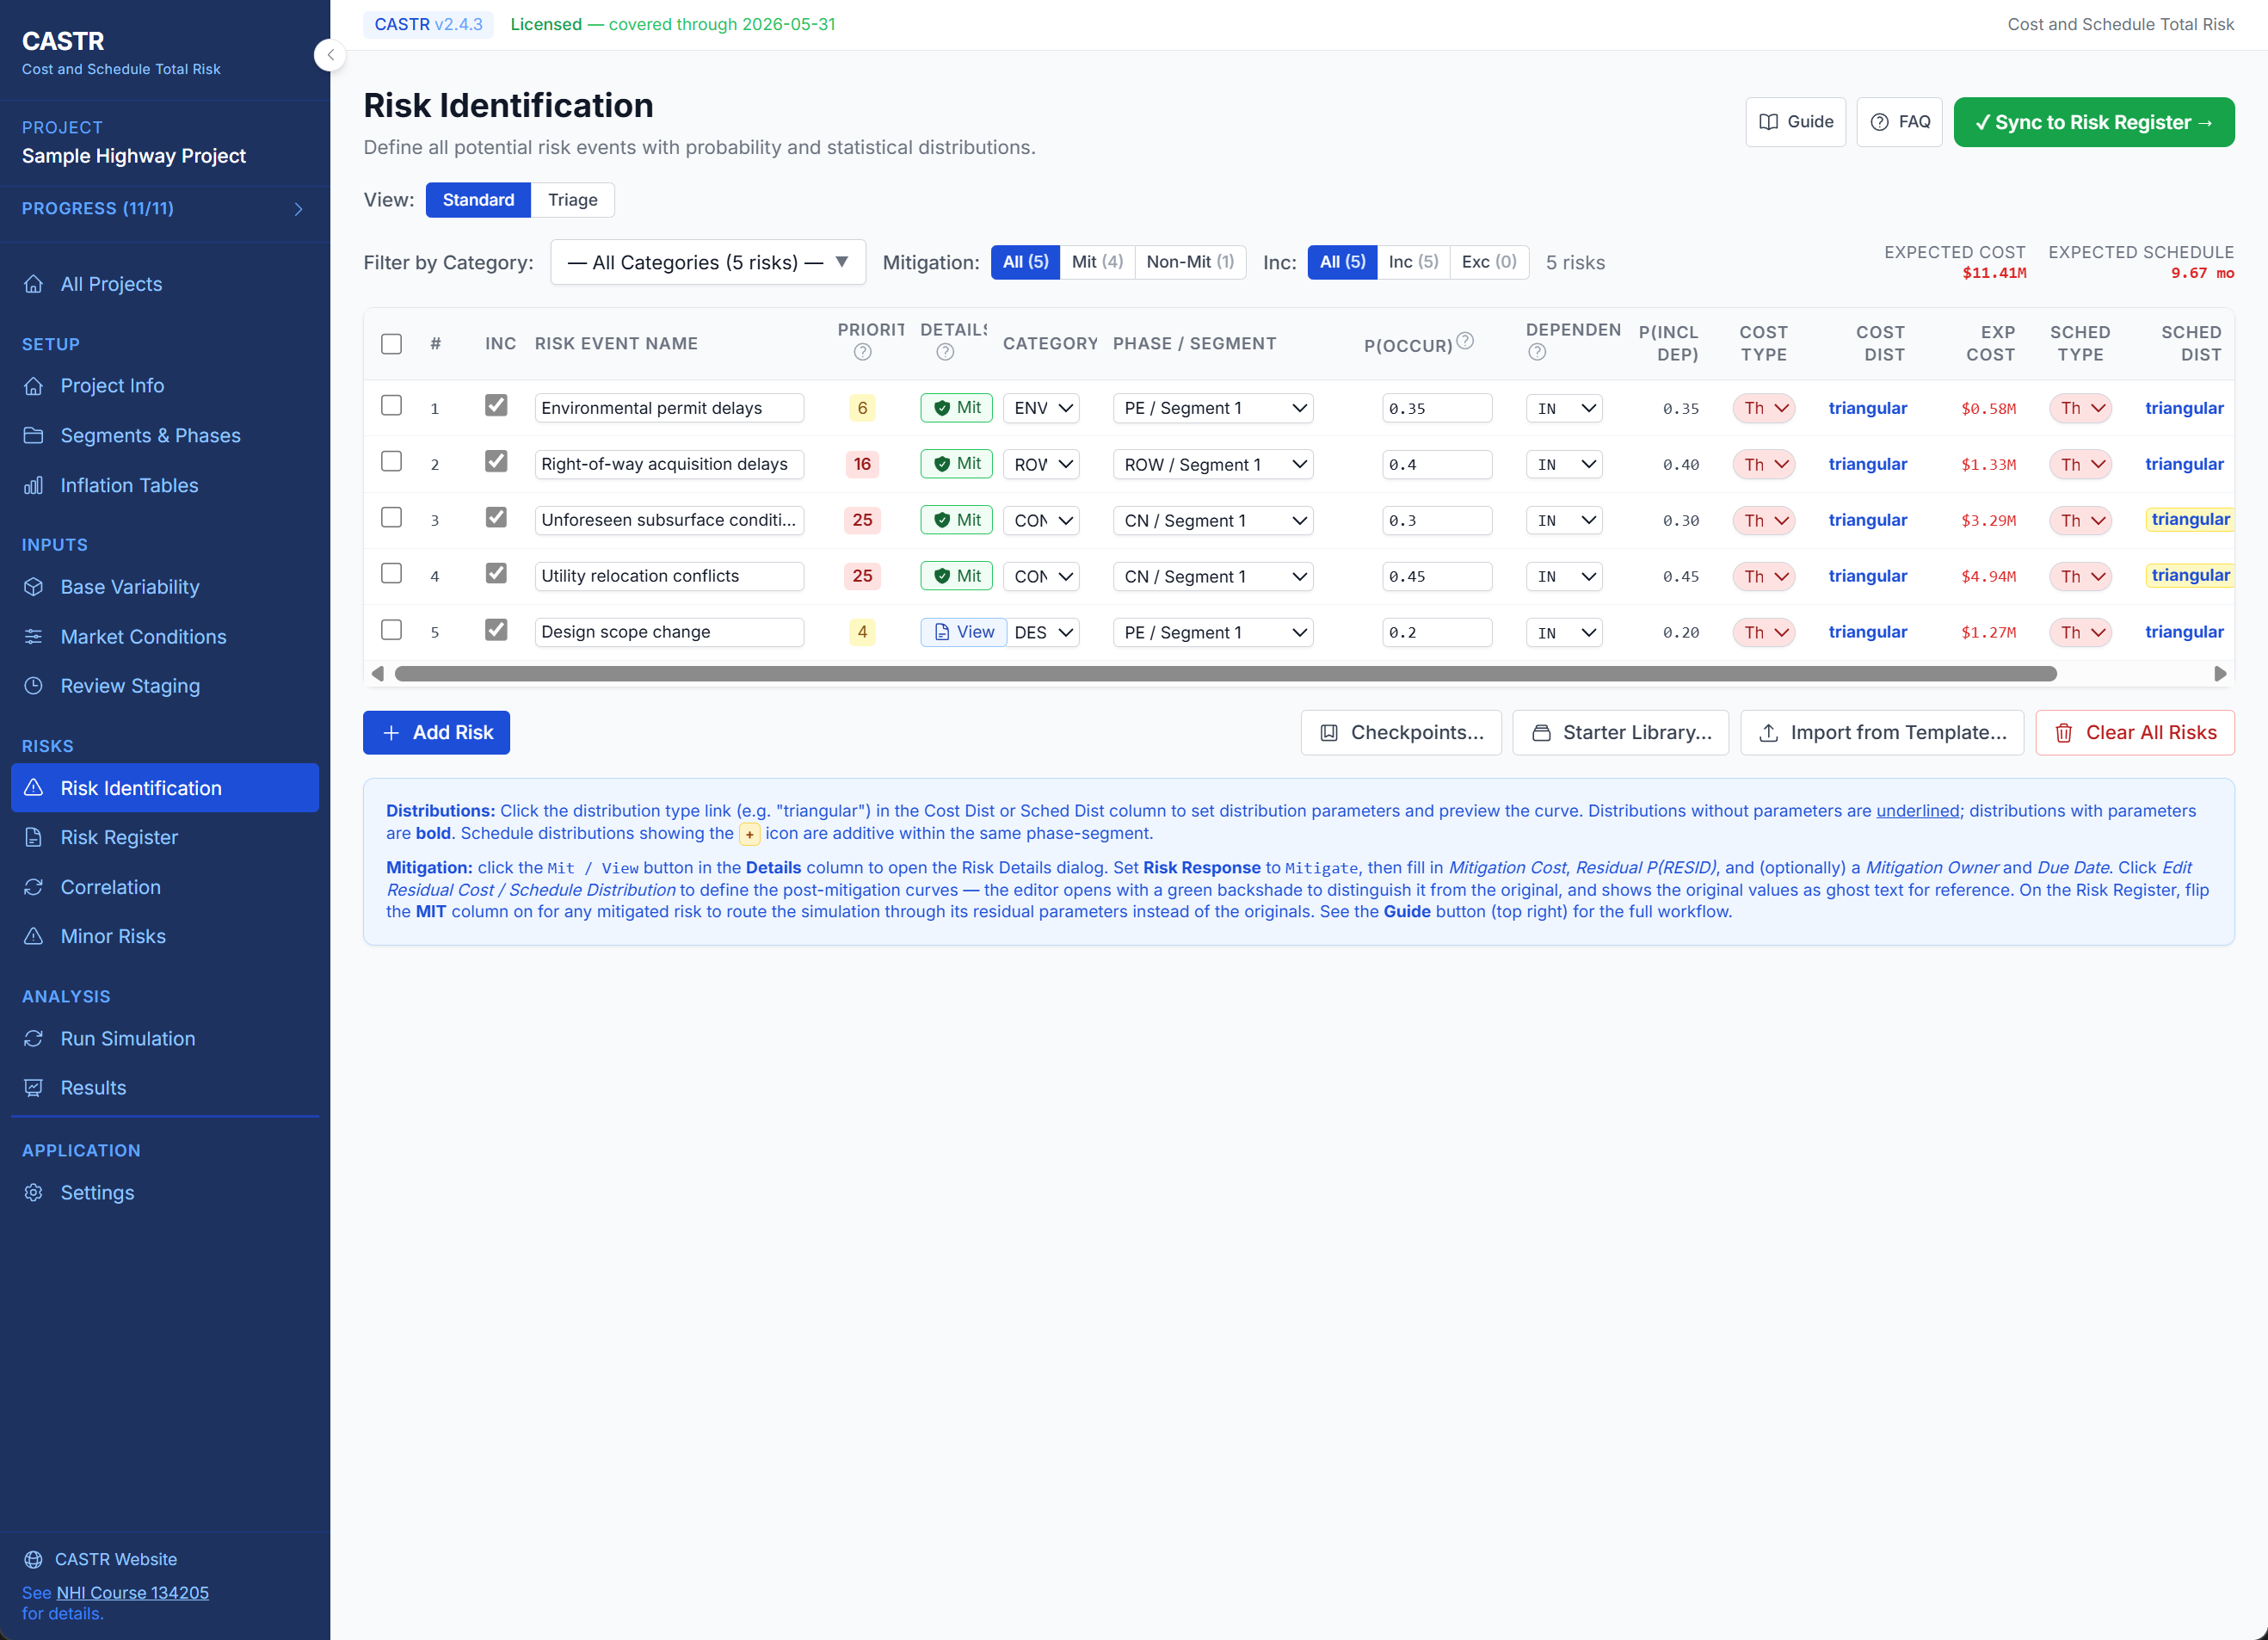
Risk Register & Reporting
Comprehensive risk register with customizable column presets (Brief, Standard, Full, Custom), row locking, MIT toggle, status tracking (Active/Inactive/Closed), orphan detection, and auto-sync from Risk Identification.
📦
Import & Export
Import risks from Excel templates with preview-before-commit and validation. Export risk registers to CSV/Excel. Generate Word (.docx) reports with embedded charts. Backup/restore complete projects with versioned manifests.
🛠
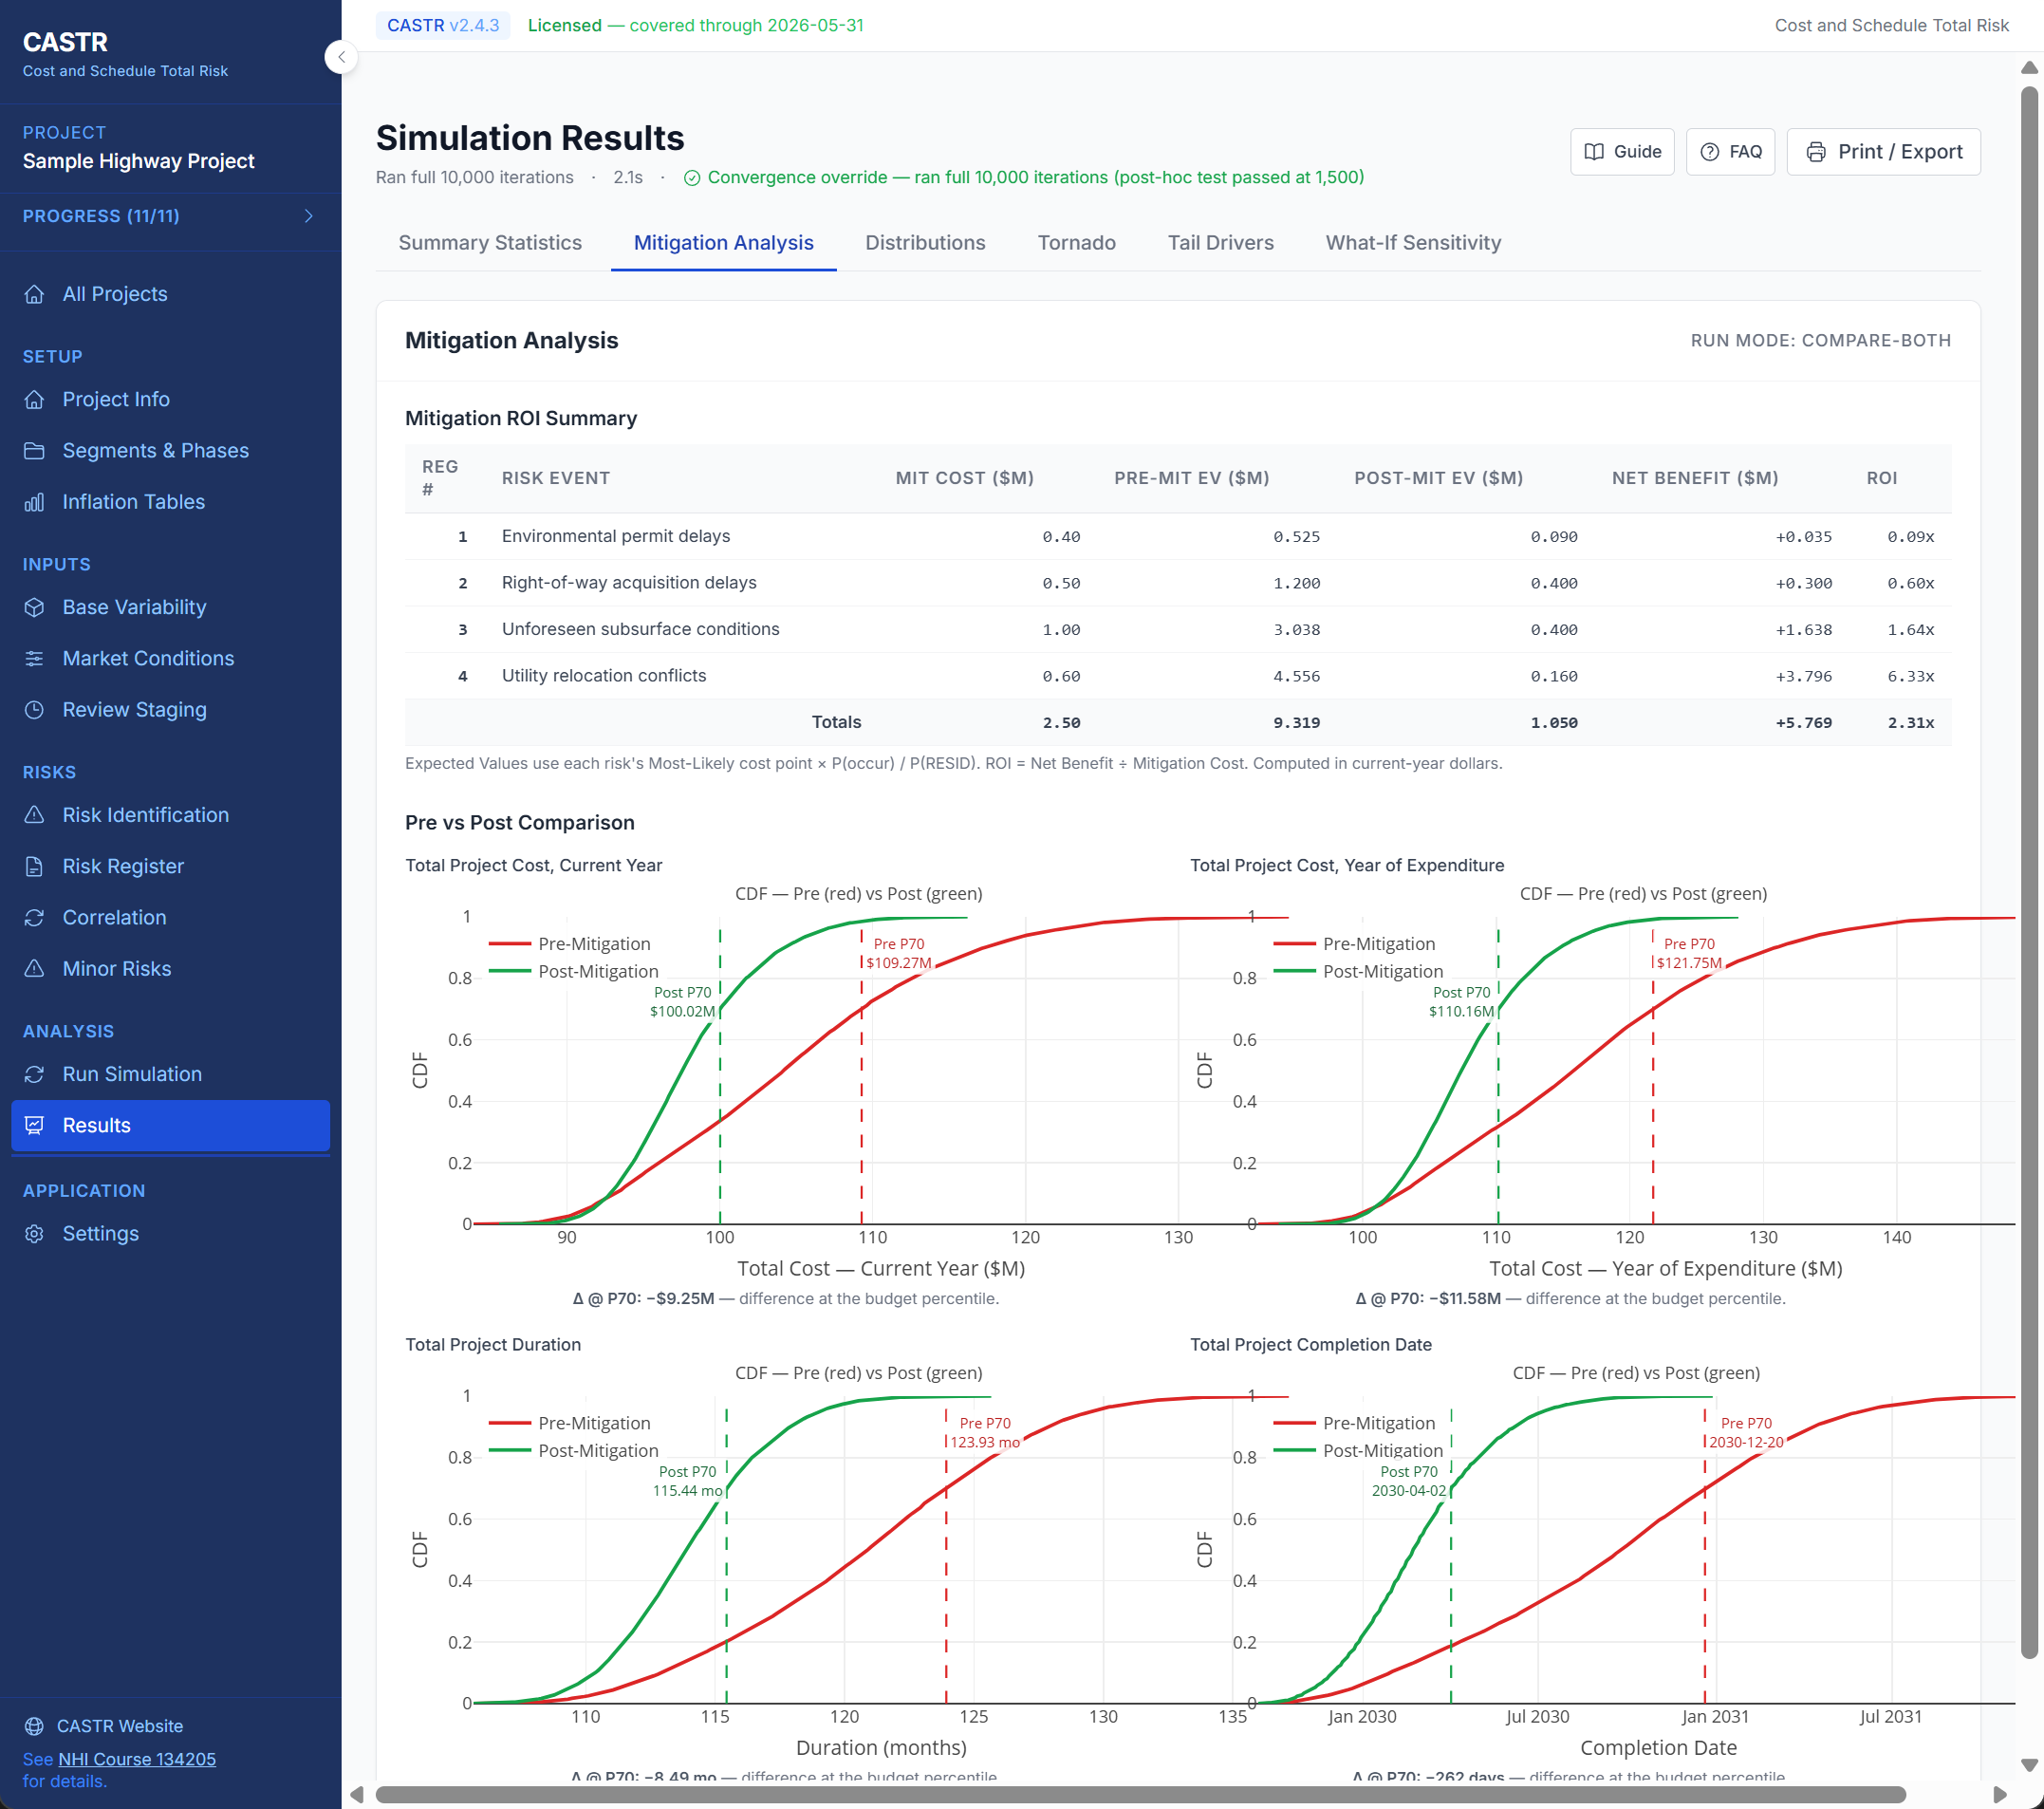
Risk Mitigation & ROI
Full risk response workflow (Accept/Mitigate/Avoid/Transfer) with mitigation cost, owner, due date, and stale-date warnings. Pre- vs. post-mitigation simulation with overlay charts and ROI table in both CY and YOE-by-scenario views.
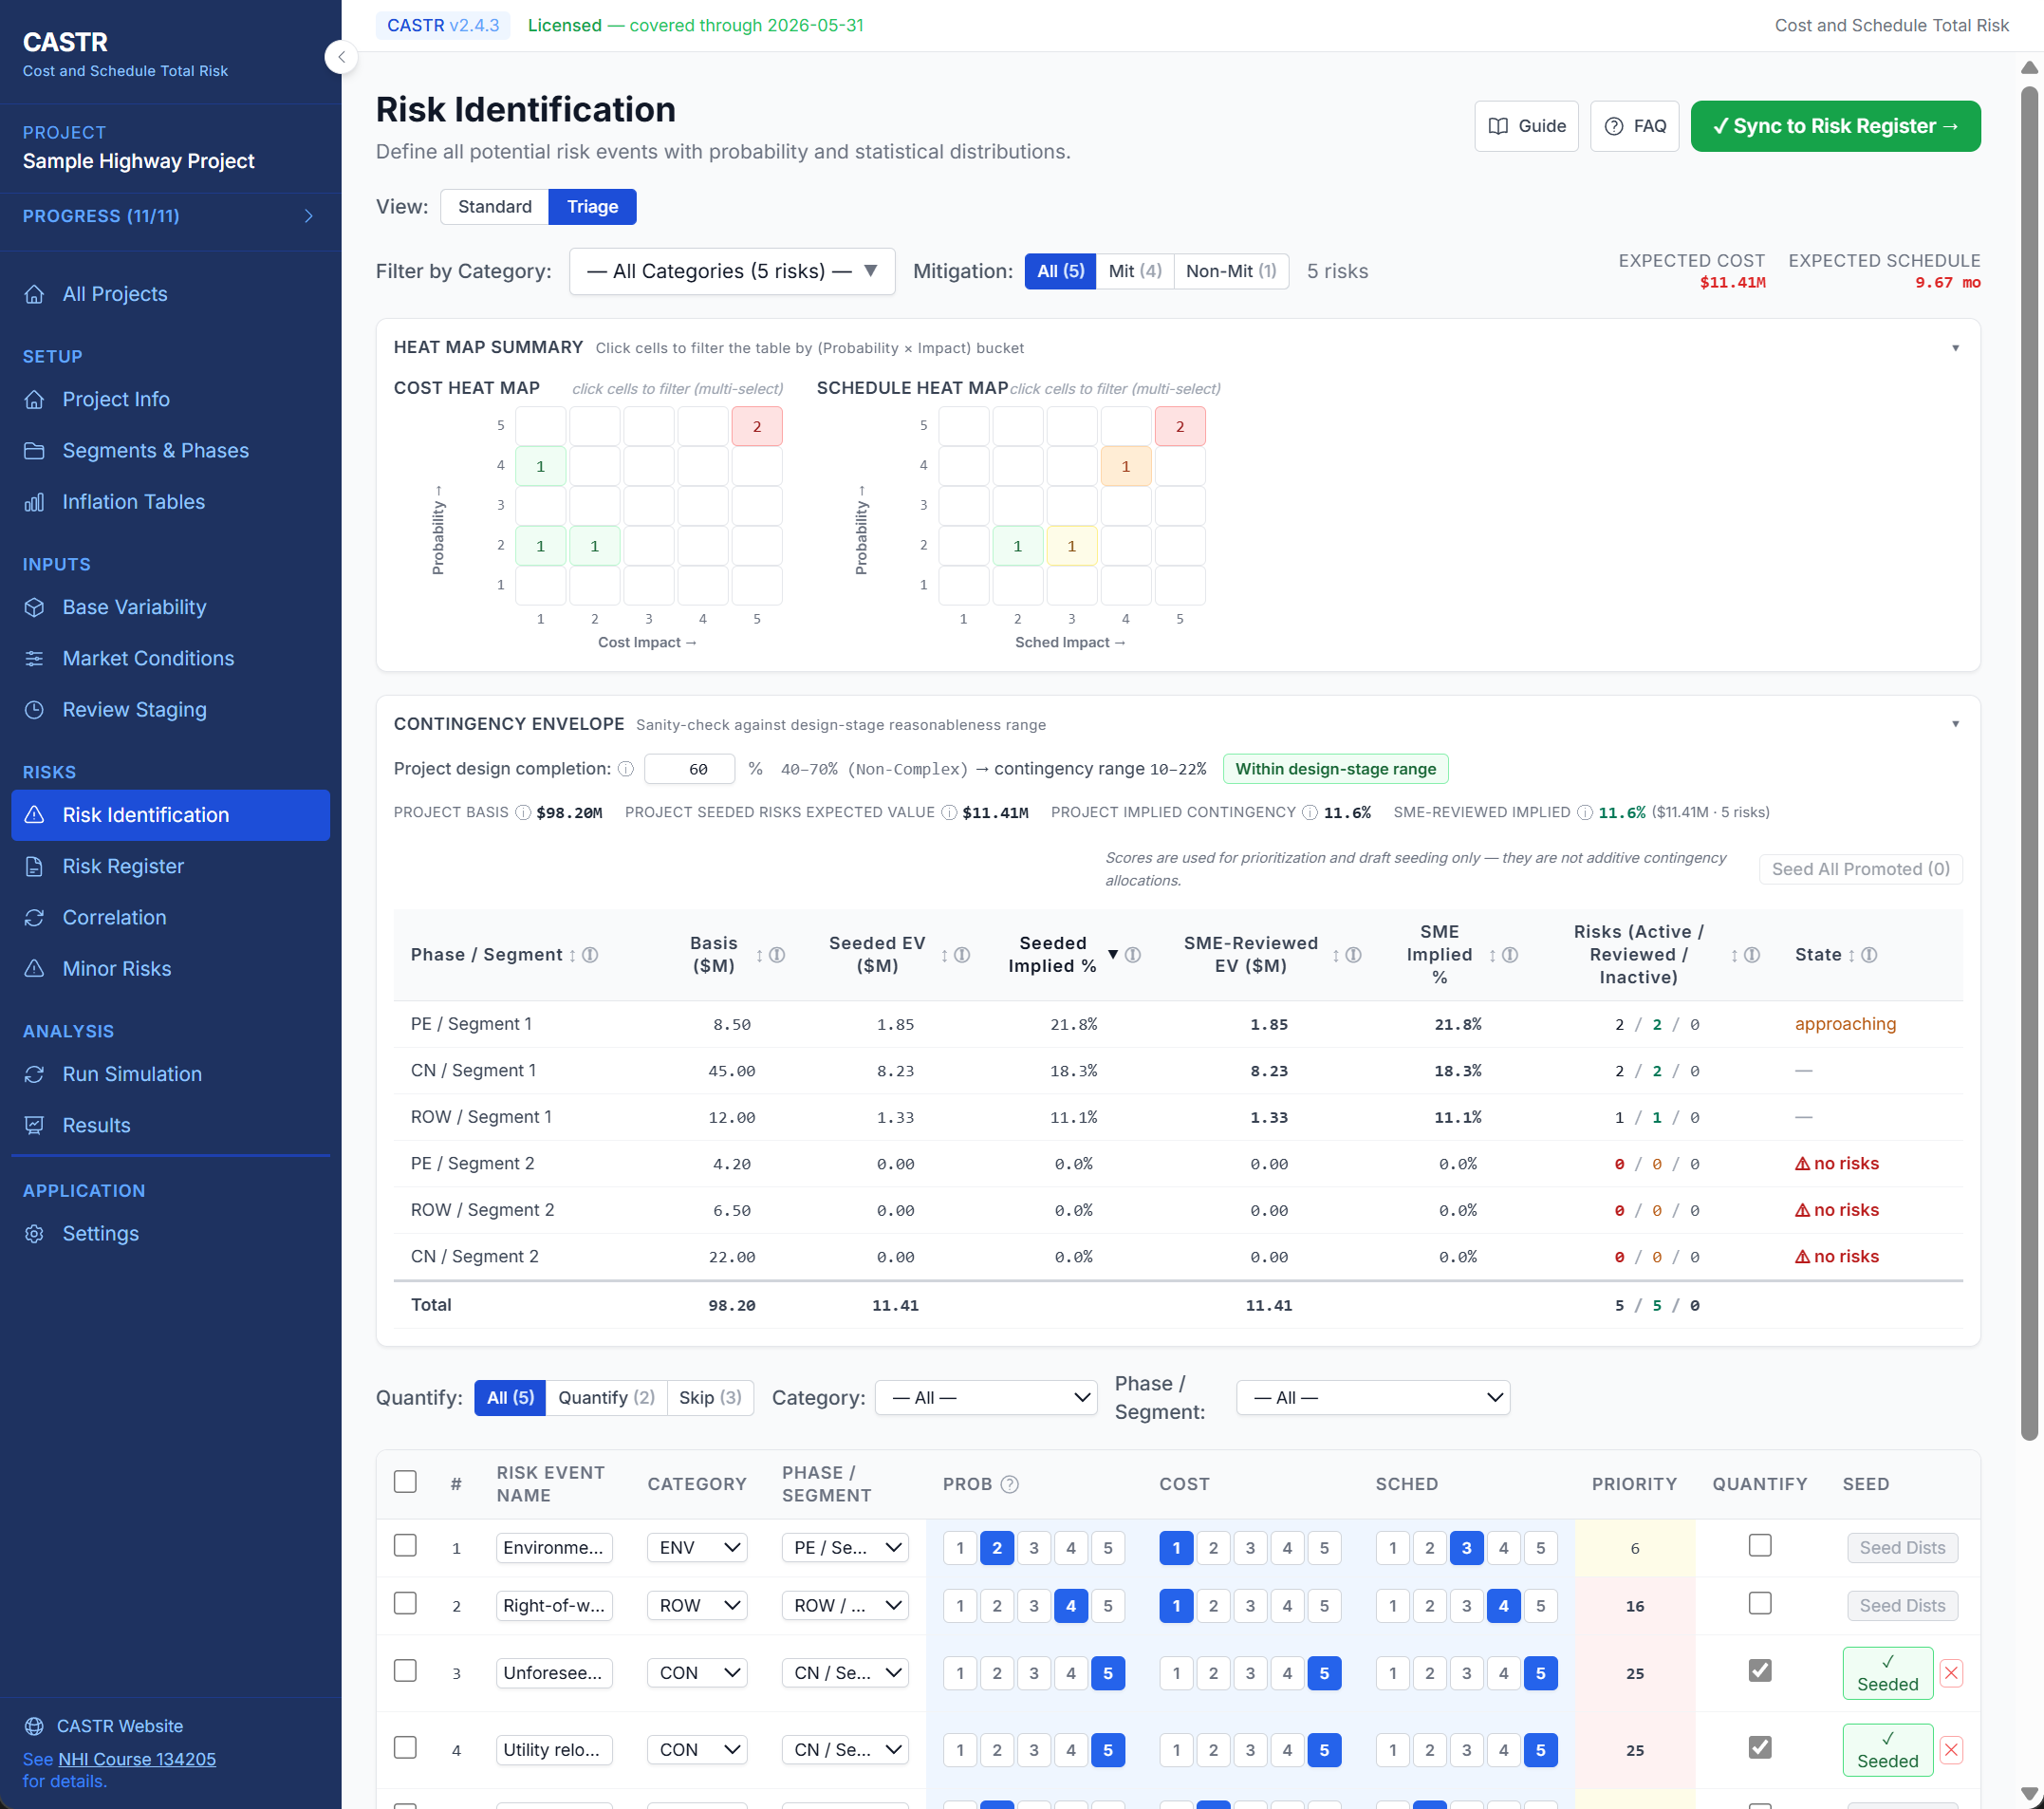
🔥
Triage View & Heat Maps
Score risks 1–5 for probability, cost, and schedule impact. Two 5×5 heat maps with click-to-filter cells. Seed button auto-generates Triangular distributions from triage scores. Contingency Envelope card benchmarks against AASHTO/design-stage bands per project complexity.
📚
Starter Risk Library
Ship with ~100 pre-built highway construction risks organized by category. Drop risks into any project in seconds and customize from there.
📈
Five Distribution Shapes
Triangular, BetaPERT, Uniform, Normal, and Constant distributions with parameter validation and live PDF/CDF preview. Model risk dependencies as mutually inclusive, mutually exclusive, or project-wide with auto-computed effective probability.
📉
Three Budget-Percentile Methods
Choose Percentile of Sum (PoS, NHI-134205 default), Sum of Phase-Segment Percentiles (SoPSP), or Sum of Segment Percentiles (SoSP). Reconstructed distribution charts reconcile visually with the chosen method.
📈
Inflation Sensitivity Scenarios
Run the same simulation across multiple inflation deltas (e.g., -3%, baseline, +5%) using cached random draws so all scenarios are bit-for-bit comparable. Sensitivity curve chart for inflation-delta extrapolation.
💚
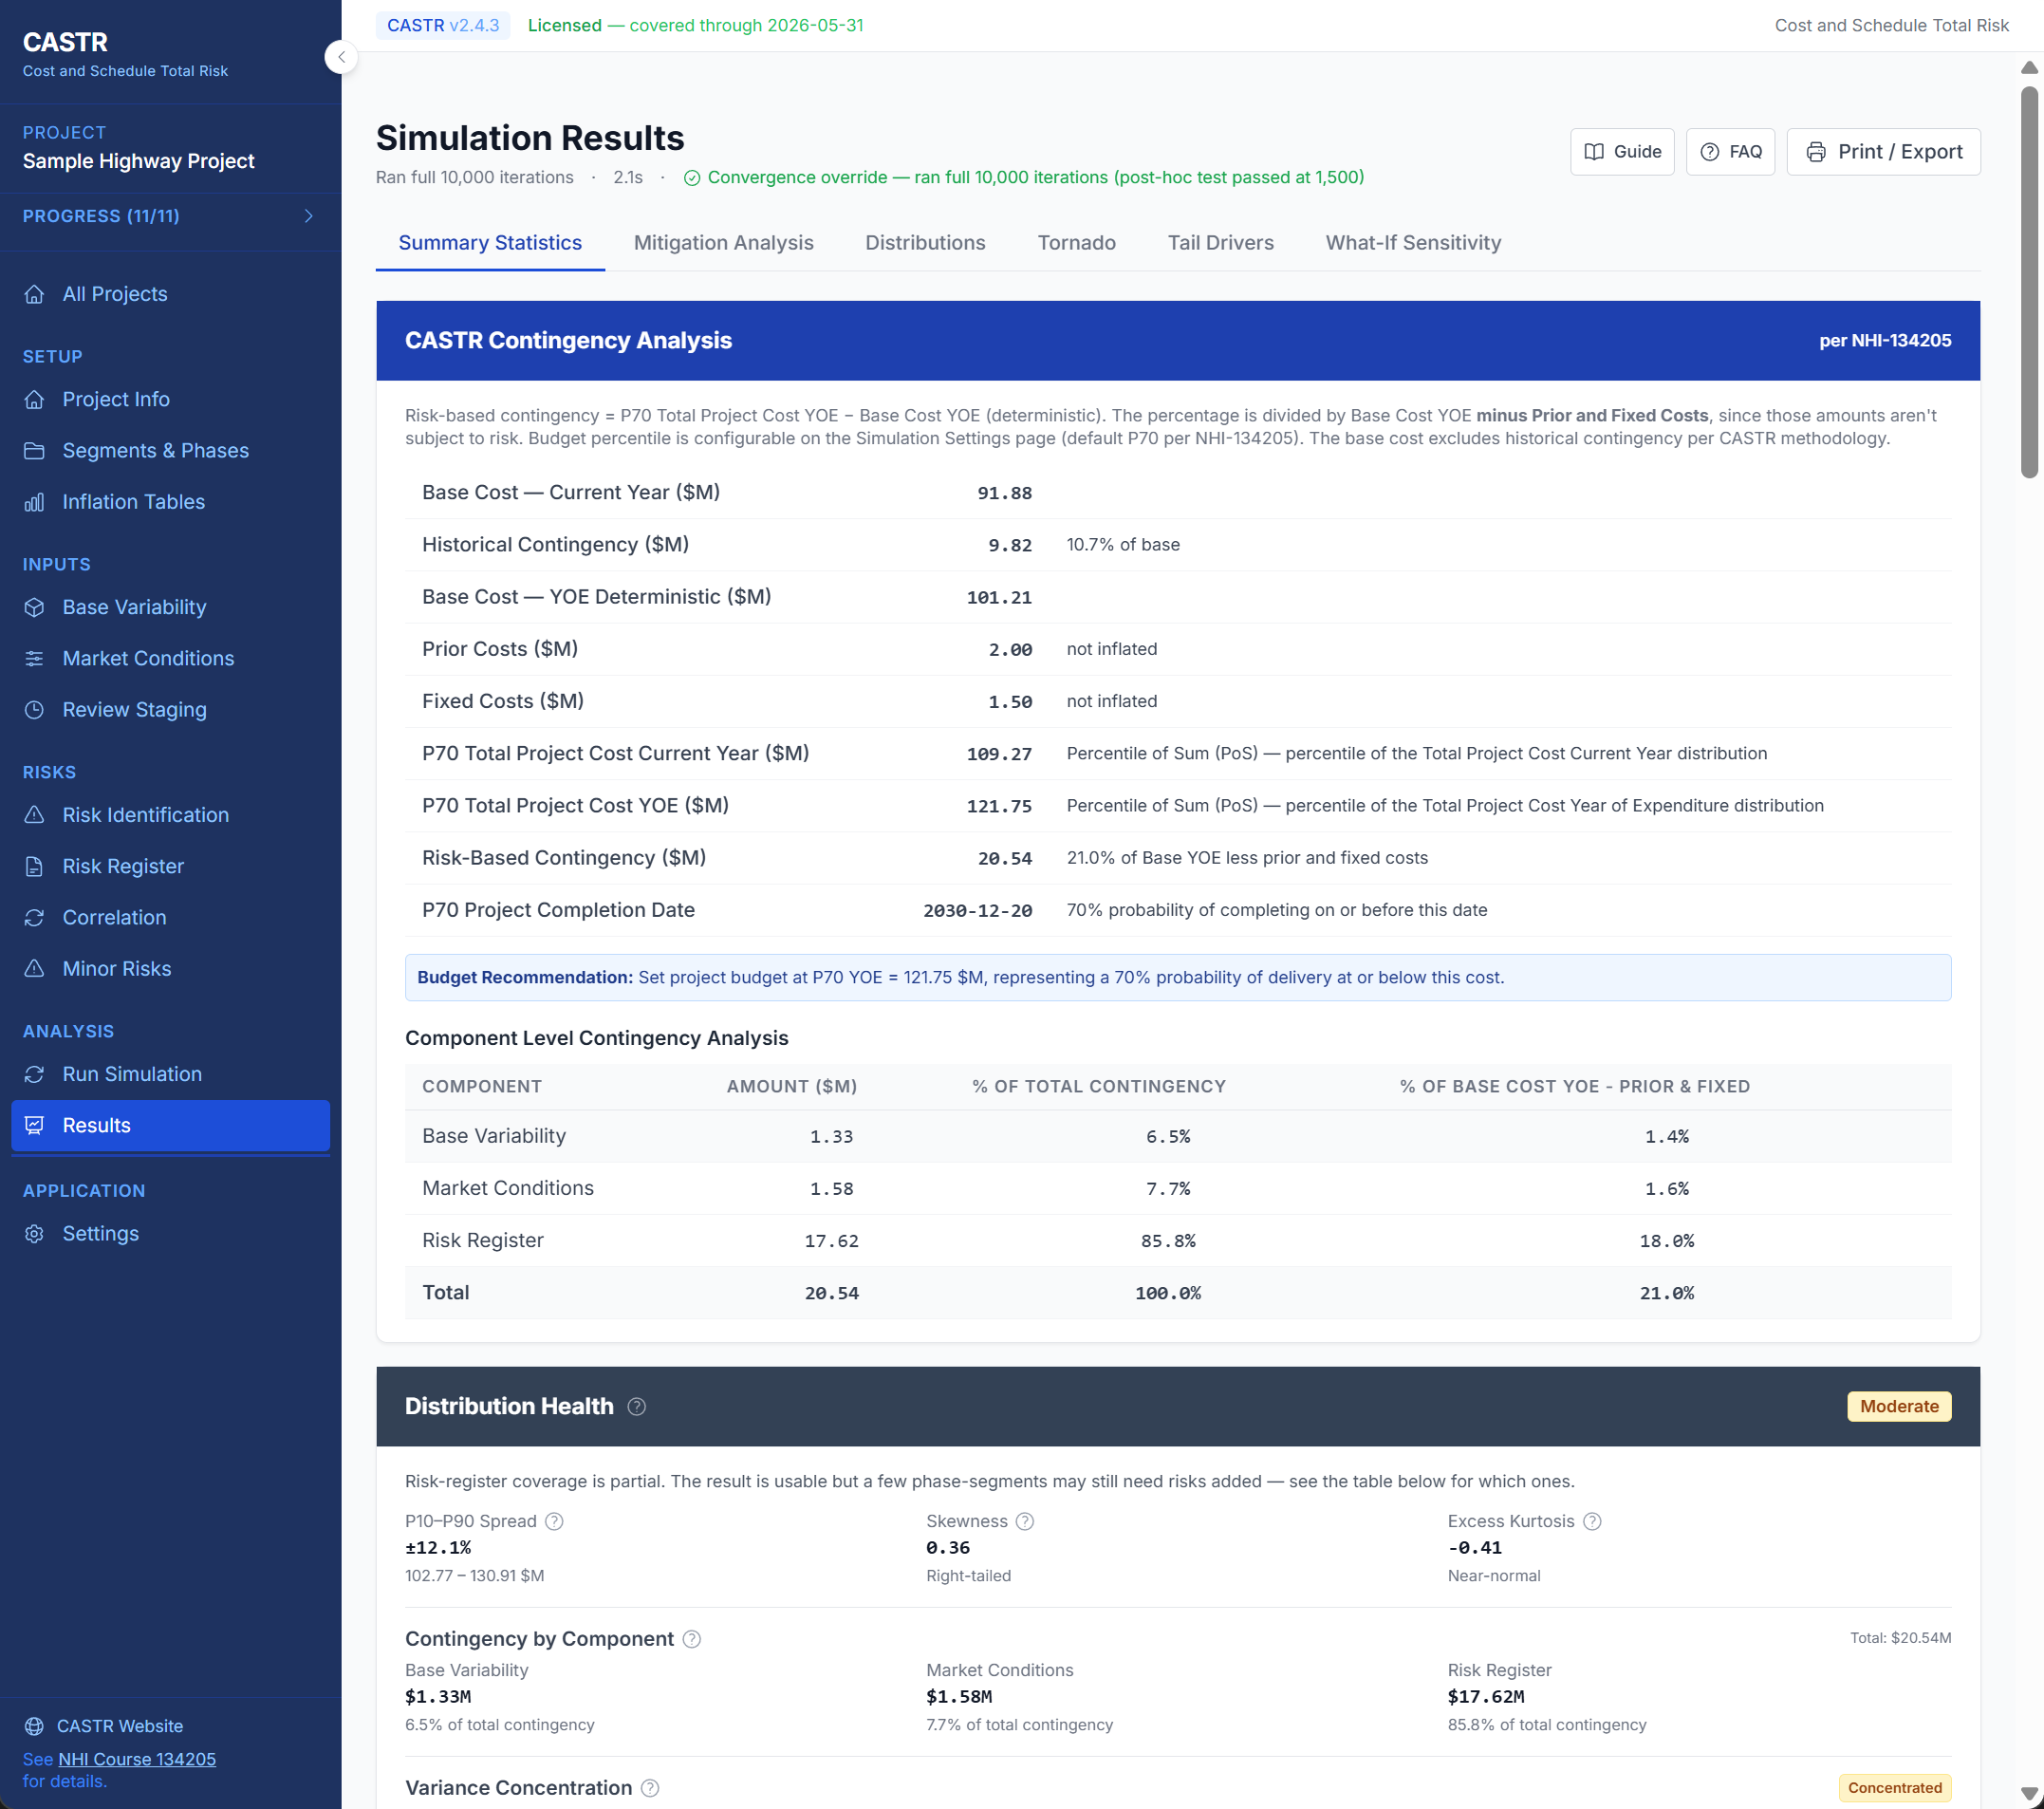
Distribution Health & Diagnostics
Coverage-driven traffic light, P10–P90 spread, skewness, excess kurtosis, variance concentration (Dominated/Concentrated/Broadly sourced), and component analysis decomposing contingency into Base Variability, Market Conditions, and Risk Register contributions.
🔒
Defensibility & Audit Trail
Convergence diagnostics saved with every run. Achieved correlation report vs. requested coefficients. Full run history with settings snapshots. Stale-results banner when inputs change after the last simulation. Pre-run validation gate.
⚙
Customizable Scoring Tables
Tailor cost and schedule scoring tables plus contingency envelope bands to match your agency's standards. Scaling factors let you bulk-adjust all Low/Mode/High cells at once.
💡
Built-In Help & Validation
Multi-layer guidance system: page-level guides, contextual FAQ panels, tooltips, and a progress checklist. Pre-run validation catches gaps before you simulate.
📷
Workshop Checkpoints
Save named snapshots during iterative risk workshop sessions. Auto-undo on destructive operations lets you explore freely without fear of losing work.
📋
Minor Risks & Allowances
Model low-impact risks as single expected-value amounts (impact × likelihood) added deterministically each iteration, keeping the risk register focused on what matters most.
🔎
Gap Detection & Warnings
Automatic gap detection in market condition scenarios highlights probability gaps between BTP/AP/WTP ranges and flags configuration issues before they affect results.
🔬
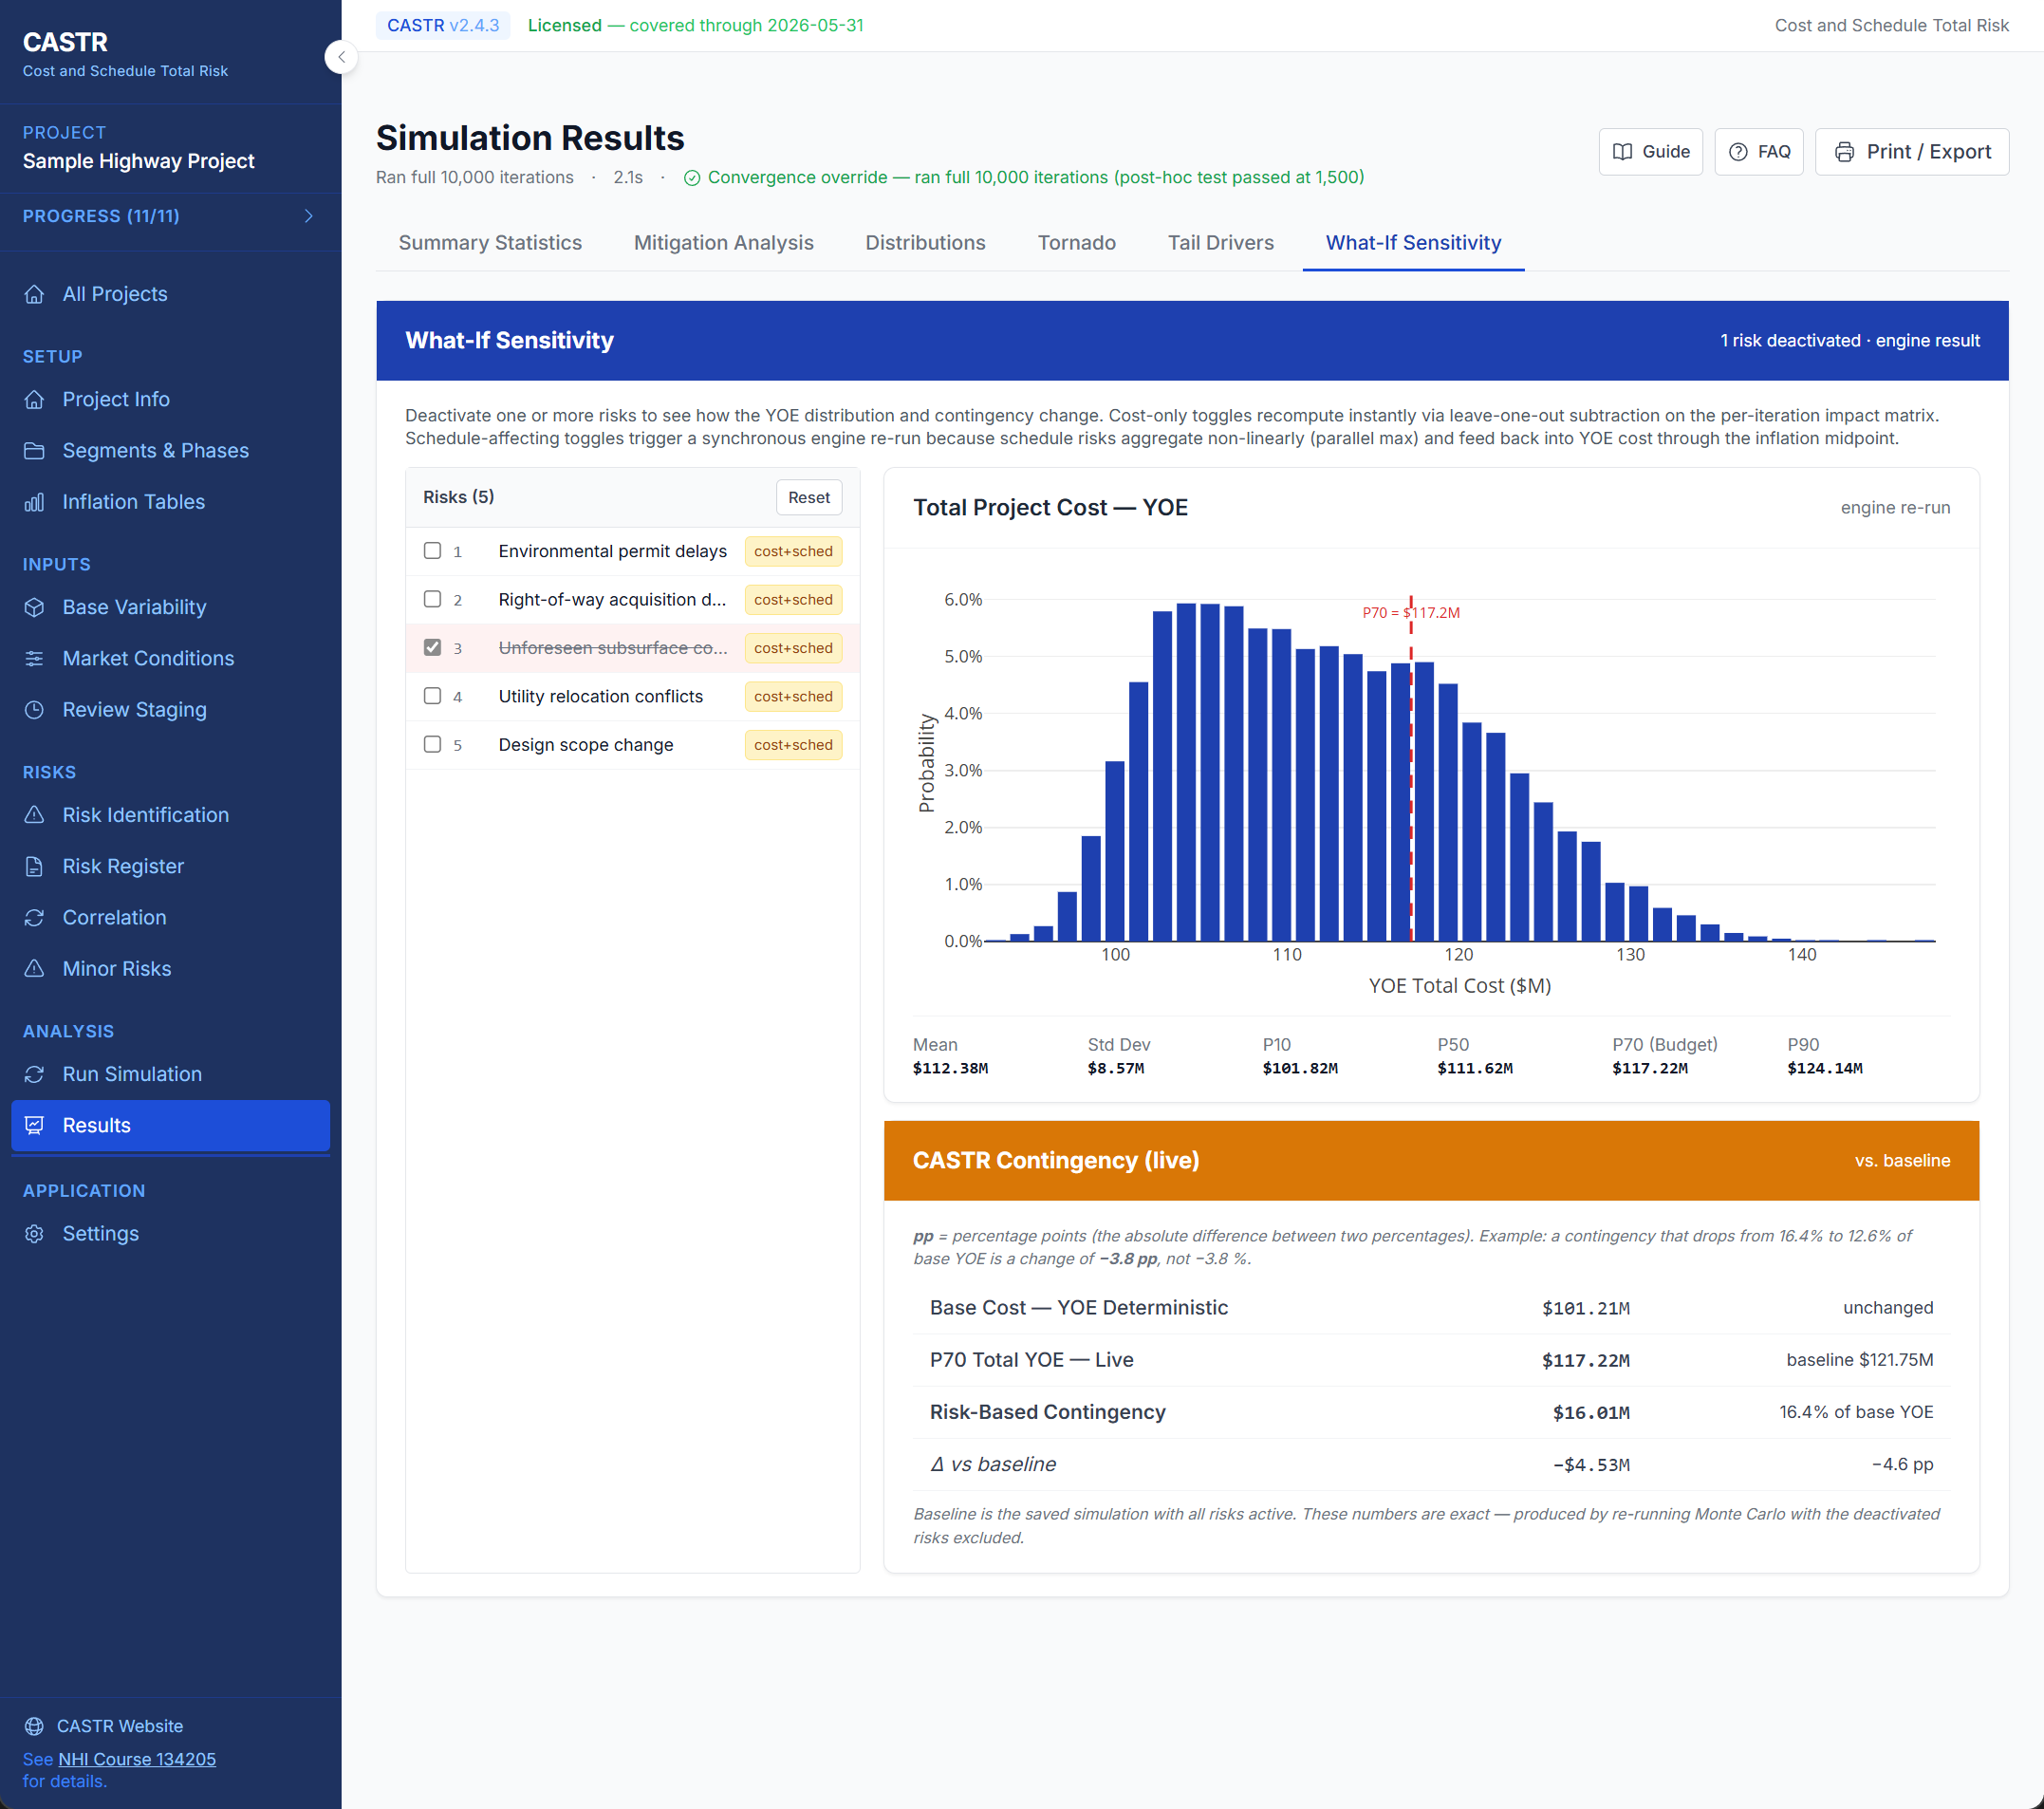
What-If Sensitivity
Deactivate risks and instantly see how the YOE distribution and contingency shift using a hybrid recompute engine — cost-only changes resolve client-side via a leave-one-out impact matrix; schedule-affecting changes trigger a synchronous engine re-run.
🖨
Print & Export
Word (.docx) report generation with embedded charts at presentation-friendly font sizes. 300 DPI PNG chart downloads for sharp Office insertion. Print-to-PDF with scenario-aware section duplication. CSV/Excel risk register export.